Watch a game from 2005 next to one from today and the modern team looks like it's shooting the lights out. In a sense it is — but not because the players are dramatically more accurate. Over the last two decades the NBA's effective field-goal percentage climbed from 47.1% to 54.7%, a massive efficiency gain. Yet raw shooting accuracy barely budged: field-goal percentage rose only from 43.9% to 47.4%, and three-point accuracy hardly moved at all. The efficiency revolution wasn't about making more shots. It was about taking better-valued ones — and that distinction is the whole story of modern basketball.
The exhibit: efficiency vs. accuracy
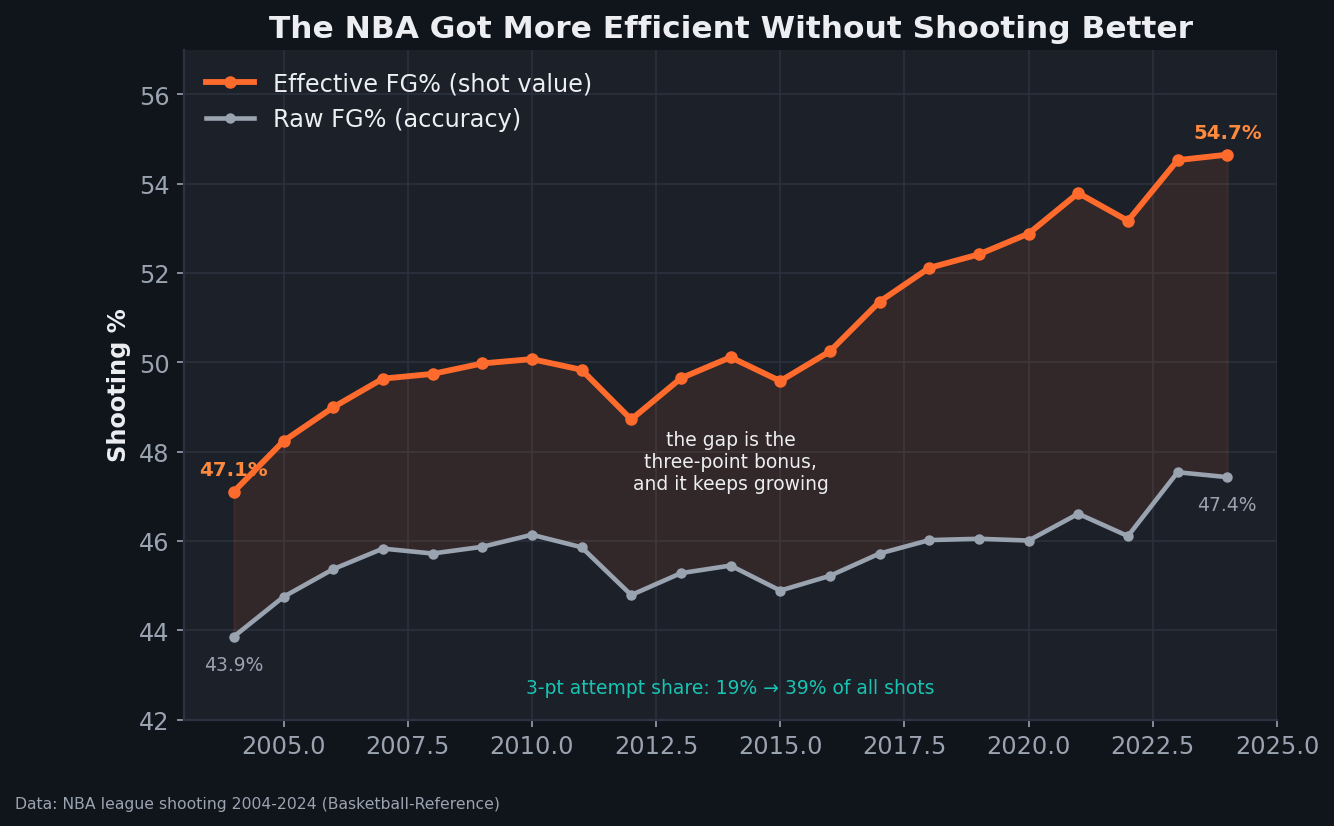
The two lines tell the whole tale. Raw field-goal percentage (the gray line) drifts up gently — players are a bit better, helped by more layups and open threes and fewer contested long twos. But effective field-goal percentage (the orange line) pulls away steadily, and the shaded gap between them — the three-point bonus — more than doubled, from about 3.2 percentage points in 2004 to 7.3 in 2024. That gap grows for one reason: teams keep taking more threes. The three-point share of all shots went from 19% to 39% over the same span.
What eFG% actually measures
Raw field-goal percentage treats every made shot the same, which is a problem when one shot is worth 50% more than another. Effective field-goal percentage fixes that by giving a made three credit for 1.5 made twos:
eFG% = (FGM + 0.5 × 3PM) / FGA
So eFG% can rise in two completely different ways: players make a higher share of their shots (accuracy), or they shift attempts toward the more valuable three (mix). The chart's message is that almost all of the modern gain came from the second channel. The league didn't get much better at the skill of shooting; it got much smarter about the value of what it shoots.
A worked example
Imagine two teams that each make 45% of their field goals — identical accuracy. Team A is a 2005 team taking 15% of its shots from three; Team B is a 2024 team taking 40% from three, at the same percentages. Even though neither makes a higher share of its shots, Team B's eFG% is several points higher, purely because more of its makes are worth three instead of two. That's the entire mechanism: same shooting skill, more points, because the shot menu changed. It's why a coach obsessed with shot selection can lift offensive efficiency without a single player improving — the lesson behind points per shot and the pace-and-space revolution.
Why accuracy stayed flat
Here's the subtle part: if everyone's taking harder, longer shots (threes), why didn't accuracy fall? Two reasons roughly cancel. The shift to threes and rim attempts came at the expense of the mid-range — the long two was the least efficient shot on the floor, so dropping it removed a lot of low-percentage attempts. And spacing improved: with defenses stretched to the arc, the rim opened up for easier finishes. The net effect on raw FG% is a small rise; the net effect on value is the big eFG climb. Teams essentially traded a bad shot (the long two) for two good ones (the three and the layup), keeping accuracy roughly stable while efficiency soared.
Where this read has limits
- eFG% still ignores free throws. It captures shot value but not foul-drawing; true shooting percentage folds in free throws and is the more complete efficiency stat. The mix story looks similar under TS%, but the exact numbers differ.
- League averages hide team variety. Some teams drove this far harder than others; the league line is a blend of three-happy and traditional offenses.
- Defense is part of the loop. As offenses optimized, defenses adjusted (more rim protection, more closeouts), so the efficiency gain is a moving target, not a free lunch that compounds forever.
- Accuracy “flat” is approximate. Raw FG% did rise about 3.5 points — not nothing — but efficiency rose more than twice as fast, so the extra gain is the mix effect.
The takeaway
The NBA's scoring boom is often told as a story of better shooters, but the data points elsewhere: shooting accuracy improved only modestly while scoring efficiency soared, because teams re-weighted their shot menu toward the three. The skill that changed the league wasn't marksmanship — it was shot selection. When you see a modern offense torch the nets, most of what you're watching is twenty years of teams learning that a 35% three beats a 45% long two, and acting on it. For the value math underneath, see the value of a possession and the death of the mid-range.
Reproduce it
From nba_three_point_trend.csv (league FGA, 3PA, FG%, 3P% by season), compute eFG% = FG% + 0.5 × 3P% × (3PA/FGA) and plot it against raw FG%. The shaded area between them is the three-point bonus. The chart is regenerated by charts/chart_efg_trend.py. No network at build time, nothing hand-entered.
Sources & Further Reading
- Free textbook: Chapter 8: Shooting Efficiency Metrics — the theory behind this, at DataField.dev.
- League shooting 2004-2024: bundled
charts/nba_three_point_trend.csv, charted bycharts/chart_efg_trend.py. Underlying data: Basketball-Reference. - Related: eFG% vs true shooting, points per shot, and the pace-and-space revolution.
- Related: the death of the mid-range — the shot this efficiency gain replaced.