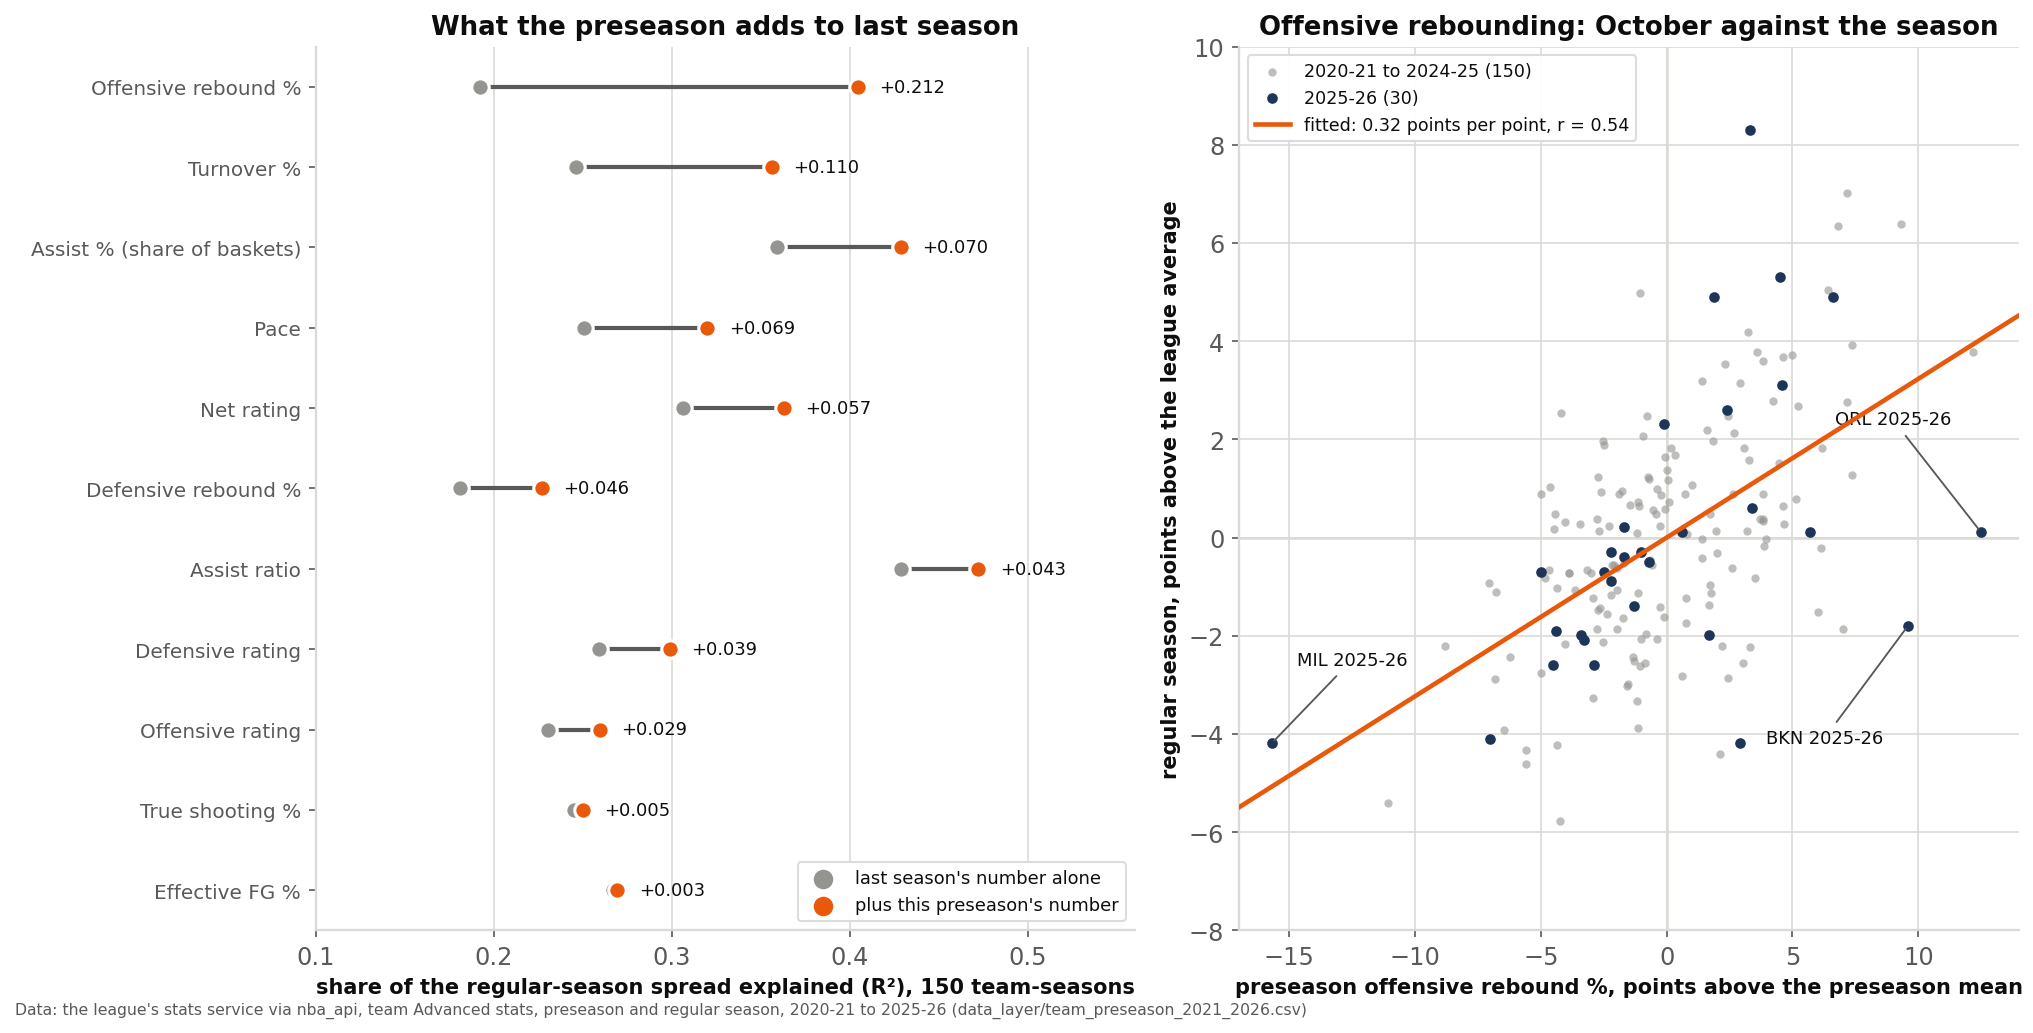
The regular season opens on Tuesday, October 20, so there is one more week of preseason box scores to over-read. In June the preseason piece measured the number people quote most, net rating, and found it barely predicts anything: r = 0.257 across 180 team-seasons. That was the right answer to the question it asked. It is the wrong question for anyone who already knows last season. A reader in October holds last season's numbers, so the useful test is what the preseason adds on top of them. We ran that test on eleven of a team's numbers over five seasons. Eight of them add a little. Offensive rebounding adds a lot: last season's rate explains 19.2% of the spread in this season's, and adding the preseason rate lifts that to 40.5%. The two shooting numbers add nothing at all.
The test
The league's stats service publishes preseason team numbers on the same basis as the regular season's. The site's files hold both for every team from 2020-21 through 2025-26, 180 team-seasons (13 rows for overseas clubs that played NBA teams in October are left out). From 2021-22 on, teams played 4.55 preseason games on average, never fewer than 3; the bubble-year 2020-21 preseason averaged 3.27.
Preseason basketball is its own sport. Averaged over the six seasons, it ran 4.38 possessions a game faster than the regular season that followed, turned the ball over on 2.77 percentage points more of its possessions, shot 2.12 points worse on effective field goal percentage and scored 6.93 fewer points per 100 possessions. So every number here is a team's distance from its own league average: preseason numbers from the preseason average, regular-season numbers from the regular-season average.
For the five seasons that have a previous season in the file, 2021-22 to 2025-26, that leaves 150 team-seasons. For each number, we fitted the regular-season figure on last season's figure alone, then on last season's figure plus the preseason's, and read the gain in explained variance. Two checks guard against an in-sample mirage. Each model was also fitted on four seasons and asked to predict the fifth, five times over. And because eleven numbers were tested, the bar for any one of them is set for eleven tests at once: a preseason coefficient needs a t-statistic above 2.88 to count.
Eleven numbers, ranked
| Statistic | r, last season | r, preseason | Explained, last season | With preseason | Preseason t | Out of sample, last season | Out of sample, with preseason |
|---|---|---|---|---|---|---|---|
| Offensive rebound % | 0.438 | 0.534 | 0.192 | 0.405 | 7.24 | 0.170 | 0.386 |
| Turnover % | 0.496 | 0.391 | 0.246 | 0.356 | 5.01 | 0.225 | 0.332 |
| Assist % (share of baskets) | 0.599 | 0.456 | 0.359 | 0.428 | 4.23 | 0.349 | 0.416 |
| Pace | 0.500 | 0.348 | 0.250 | 0.320 | 3.88 | 0.239 | 0.294 |
| Net rating | 0.553 | 0.277 | 0.306 | 0.363 | 3.62 | 0.303 | 0.354 |
| Defensive rebound % | 0.426 | 0.273 | 0.181 | 0.227 | 2.95 | 0.175 | 0.206 |
| Assist ratio | 0.655 | 0.394 | 0.429 | 0.472 | 3.48 | 0.426 | 0.457 |
| Defensive rating | 0.509 | 0.231 | 0.259 | 0.299 | 2.88 | 0.258 | 0.276 |
| Offensive rating | 0.480 | 0.181 | 0.230 | 0.259 | 2.40 | 0.220 | 0.246 |
| True shooting % | 0.495 | 0.105 | 0.245 | 0.250 | 0.98 | 0.238 | 0.229 |
| Effective FG % | 0.517 | 0.112 | 0.267 | 0.269 | 0.73 | 0.264 | 0.250 |
Three things stand out. First, last season is the better single guide on ten of the eleven numbers, usually by a wide margin. Second, the preseason still adds to it on nine: seven clear the eleven-test bar (offensive rebounding, turnovers, both assist measures, pace, defensive rebounding and net rating), defensive rating misses it by a hair at 2.88, and offensive rating falls short at 2.40. Third, the two shooting numbers add nothing. Out of sample, adding preseason shooting makes the forecast worse: 0.238 to 0.229 for true shooting, 0.264 to 0.250 for effective field goal percentage. Measured from where last season left a team, preseason shooting points the right way for 80 of the 150 team-seasons, 53%, a coin with a slight lean.
data_layer/team_preseason_2021_2026.csv (180 team-seasons from the league's stats service, retrieved June 2026). Charted and verified by chart_the_october_glass.py, 96 asserts.The glass
Offensive rebounding is the exception on every count. Its preseason correlation with the regular season, 0.534, is the highest of the eleven and the only one above last season's, 0.438. Across all 180 team-seasons it is 0.543. Season by season the preseason beat last season in four of five years: 0.42 against 0.22, 0.62 against 0.42, 0.40 against 0.27, 0.69 against 0.49, then 0.50 against 0.67 in 2025-26. That head-to-head is not settled. Resampling whole franchises 2,000 times, the preseason's lead runs from −0.04 to 0.24, so the honest claim is a tie or better, not a win.
The gain from combining them is settled. Last season alone explains 19.2%; with the preseason added, 40.5%, more than double. None of 10,000 shuffles of the preseason numbers within each season came close. Predicting each season from the other four, the out-of-sample share goes from 0.170 to 0.386, and the error fell in all five seasons.
Model this season's rate above average = 0.385 × last season's + 0.291 × this preseason's
All three are in percentage points from the league average. The preseason weight is 0.291 (standard error 0.040; 0.20 to 0.39 across the franchise resamples), last season's 0.385 (standard error 0.071). The smaller weight hides how much the preseason moves the forecast, because preseason rates spread much wider: a typical preseason gap is 4.07 points, last season's 2.30. One typical gap moves the forecast 1.18 points from the preseason and 0.89 from last season.
Why rebounding? The file cannot say, but the pattern fits a choice more than a skill. How many players a team sends to the offensive glass is a coaching decision about the trade between second chances and transition defense, and it is the kind of decision a staff installs in camp and keeps. The offensive rebounding piece covers what a second chance is worth. Shooting percentage, by contrast, is an outcome that swings from night to night. Over four or five October games against rotations full of camp invitees it is mostly noise, and that is what the numbers say. League-wide, offensive rebounding is also on the move: 26.4% in 2020-21, 29.3% in 2024-25, 30.5% last season. A number that changes that much from year to year is one where last season is a weaker guide and fresh evidence counts for more.
Net rating, revisited
The June piece pooled raw preseason and regular-season net ratings and got r = 0.257. The same calculation on this file gives 0.257 again, and 0.258 within seasons, so the two pieces start from the same numbers. On its own, preseason net rating explains 6.6% of the spread, as June said. Added to last season's net rating, it lifts the explained share from 30.6% to 36.3%, a real gain (t = 3.62) and a modest one. The June piece's verdict on net rating alone stands; its advice to treat all of October as noise was too broad.
Most of that gain does not come from the scoreboard. Replace preseason net rating with the preseason's offensive rebounding and turnover rates and the forecast of regular-season net rating is just as good: 36.1% against 36.3%. Preseason shooting alone lifts it only to 31.6%. What October says about a team's quality, it says through the possessions a team keeps and gives away, not through the shots that fall.
What it looked like last season
The model is a nudge, and 2025-26 showed how far a nudge can miss. The three teams whose preseason rebounding sat farthest from where 2024-25 had left them all moved the other way in the regular season.
Orlando is the largest case. In 2024-25 it rebounded 30.2% of its misses, 0.9 points above the league's 29.3%. In a 4-0 preseason it rebounded 44.3%, 12.5 points above that preseason's 31.8% average. The model: 0.385 × 0.9 + 0.291 × 12.5 = 0.35 + 3.64 = +4.0 points above the league; the league finished at 30.5%, so about 34.5%. Orlando rebounded 30.6%, 0.1 above the league. Last season's number alone, carried at 0.48 a point, said +0.45 and was the better forecast.
Milwaukee ran the other way. 23.5% in 2024-25, 5.8 below the league; 16.1% in the preseason, 15.7 below. The model: 0.385 × −5.8 + 0.291 × −15.7 = −2.23 − 4.57 = −6.8, about 23.7%. Milwaukee rebounded 26.3%, 4.2 below. Brooklyn's 41.4% preseason (9.6 above) became 28.7% in the regular season, 1.8 below the league. For all three, last season alone was closer.
That is one season's loudest signals, not the record. Over all five seasons, 73 teams had a preseason rate at least 3 points away from where last season placed them, and 57 of them, 78%, moved that way in the regular season. In 2025-26 it was 9 of 14, the weakest of the five years, and even then the out-of-sample error was smaller with the preseason than without it, 2.23 points against 2.38.
Reading this October
The site has not pulled this preseason's numbers, and the method does not need us to. For any team, take its preseason offensive rebound percentage minus the average of all 30 teams' preseason rates, and last season's rate minus last season's league average. Multiply the first by 0.29 and the second by 0.38 and add them: that is the expected gap from the league average this season, in points. Do the same with turnover percentage (0.153 and 0.447) if you want a second read. Then ignore the shooting lines, whatever they say. The four-factors calculator turns any box score into these rates, and the four-factors piece explains why rebounding and turnovers sit next to shooting in the first place.
What this does not show
- That the preseason beats last season. Only for offensive rebounding does it even tie, and that lead is inside the resampling noise. Everywhere else last season is the better single guide, and the right use of October is as an addition.
- Why rebounding carries. The coaching-choice reading above is an interpretation. The file has no coaching changes, rotations or minutes, so it cannot be tested here.
- Much about wins. Rebounding rate is one of the four factors, not the result. A team can crash the glass and still lose the possessions it gives up in transition.
- Roster news. Trades, injuries and signings move every number here, and the preseason captures some of that change by construction. The continuity piece measures one part of it directly.
- A long record. Five seasons and 150 team-seasons are enough for the big effects above and not for fine distinctions: the order of pace, net rating and defensive rebounding in the middle of the table could easily change with more years.
- Opponents. Preseason games come against whatever lineups the other side plays, including overseas clubs. Nothing here adjusts for that.
Reproduce it
data_layer/build_preseason_carry.py turns the league's cached team pulls (LeagueDashTeamStats, Advanced, per game, preseason and regular season, 2020-21 to 2025-26, retrieved June 2026) into data_layer/team_preseason_2021_2026.csv, one row per team-season, dropping the overseas clubs. chart_the_october_glass.py checks every value in that file against the cached pulls, computes every number above, runs the leave-one-season-out fits, the 2,000 franchise resamples and the 10,000 shuffles on a fixed seed (20261013), pins each figure with an assert (96 in all), checks this page's text and table against the data, and draws the chart. Both run offline from the bundled files.
The bottom line
Last season is still the best single thing to know about a team in October, for ten of the eleven numbers here. But a preseason is not one number. Its shooting is noise that makes a forecast worse. Its rebounding is close to the most informative thing a team will show before opening night, and it more than doubles what last season alone explains. When a team spends October crashing the offensive glass, believe it more than anything it shoots.
Sources & Further Reading
- Team preseason and regular-season numbers, 2020-21 to 2025-26: NBA.com/stats via nba_api (LeagueDashTeamStats, Advanced, retrieved June 2026), bundled as
data_layer/team_preseason_2021_2026.csv. - The opening date: the NBA's 2026-27 regular-season schedule release (NBA Communications, read October 13, 2026), which has the season beginning on Tuesday, October 20, matching ESPN's published schedule for that date.
- Related on this site: Does Preseason Performance Predict Anything?, offensive rebounding and second-chance points, the four factors, pace and possessions, The Turnover Floor, The Continuity Dividend and The Giveback.