The Lakers won 53 games last season while outscoring opponents by 1.76 points a game, the margin of a 45-win team. Charlotte won 44 while outscoring opponents by 4.83, the margin of a 53-win team. Those are two of the widest gaps between a record and a margin in the 27 seasons of the site's team file, and both came in the season a 2026-27 forecast starts from. Every October someone carries last season's record forward anyway. The record says what happened; the margin says more about what is likely to happen again. Across 774 pairs of consecutive seasons since 1999-00, a win that a team's point margin earned carried 0.63 of a win into the next season, and a win it collected beyond its margin carried 0.21. Most of the luck goes back.
Two kinds of wins
Pythagorean expectation turns a team's points scored and allowed into the winning percentage those points usually produce. The Pythagorean piece covers where the formula comes from and traces its NBA exponent to Daryl Morey. Here it is a measuring stick.
Pythagorean win% PF^13.91 ÷ (PF^13.91 + PA^13.91)
13.91 is the exponent the site's calculator uses. Fitted to the 805 team-seasons in the file, 1999-00 to 2025-26, the best exponent is 13.88, and the fit is the same either way: an error of 2.97 wins per 82 games. A team's Pythagorean wins are that percentage times 82. Its luck is its actual wins minus its Pythagorean wins, scaled to 82 games so that the 66-game 2011-12 season and the shortened 2019-20 and 2020-21 seasons sit on the same scale. Luck is shorthand for whatever the margin did not predict, and a later section measures how much of it deserves the name.
Across the 805 team-seasons, luck has a standard deviation of 2.97 wins. It is not a property of good teams or of high-scoring ones: its correlation with point margin is r = −0.01, and with points scored relative to the season's average −0.03. Even 73-9 had some. The 2015-16 Warriors had a margin worth 65.4 wins and won 73, a gap of +7.6.
What carries over
Line up every team with the same franchise a season later, 774 pairs in all, and fit next season's record on the two kinds of wins. Franchises are followed by the league's permanent id, so Seattle becomes Oklahoma City; as in the parity piece, the Hornets' 2002 move to New Orleans starts a new id.
Model next season's wins = 15.13 + 0.631 × Pythagorean wins + 0.208 × luck
A Pythagorean win carries 0.631 (standard error 0.029) into the next season. A luck win carries 0.208 (standard error 0.118). The gap between them, 0.422, is 3.5 standard errors. A franchise's seasons are not independent of one another, so we also resampled whole franchises 2,000 times: the luck coefficient runs from −0.03 to 0.43 and the margin coefficient from 0.58 to 0.68, and the two ranges do not meet.
The 0.208 splits in two. Of it, 0.103 turns up in next season's margin (standard error 0.116), which cannot be told apart from nothing, and 0.105 (standard error 0.036) turns up as luck again. The rest of a lucky win is gone.
Grouped, it looks like this. The 66 teams that outran their margin by four wins or more, by +5.16 on average, won 3.85 fewer games the next season, and their luck that season averaged +0.31. The 66 that fell four or more short, by −5.77 on average, won 3.79 more, with luck of −0.90. Fitted across all 774 pairs, every win of luck cost 0.79 wins the next season (standard error 0.13). That is not the familiar pull of a good team back toward the pack. Luck is unrelated to margin, so the drop is the luck leaving.
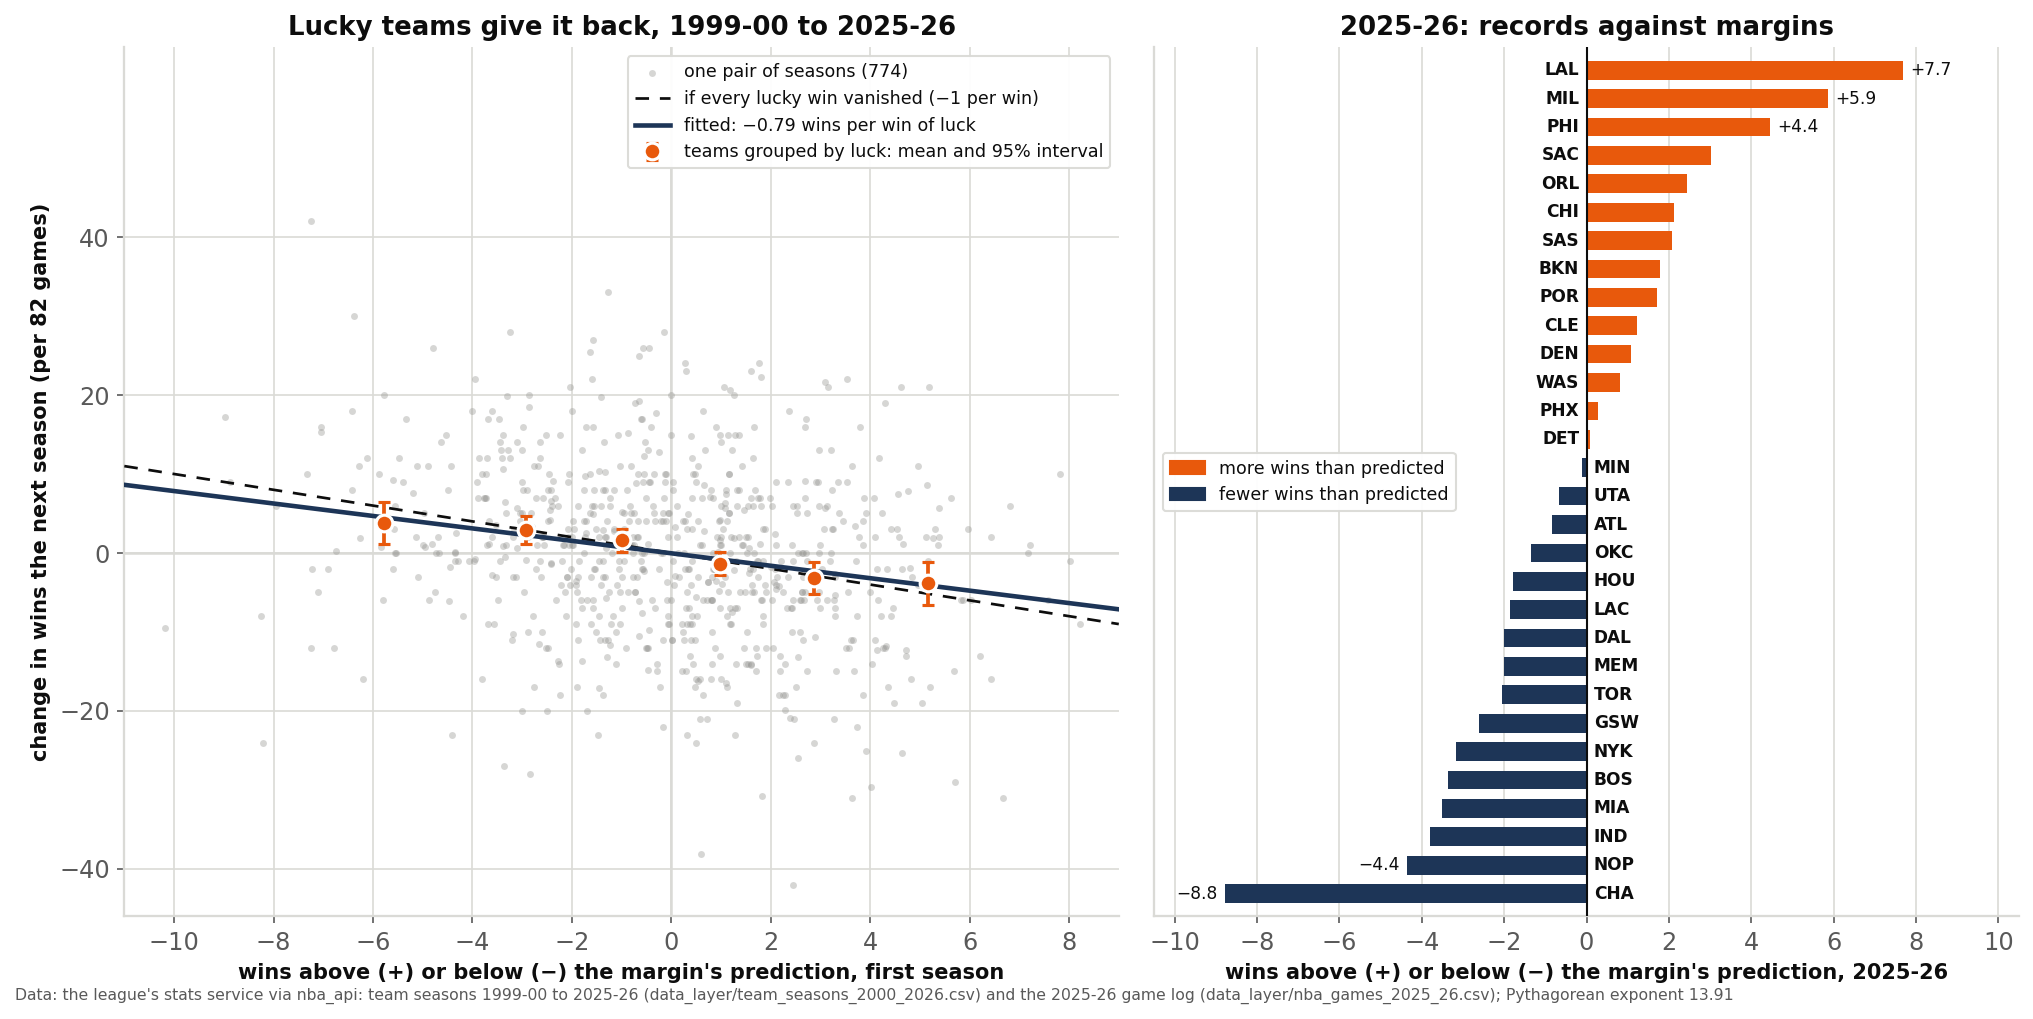
data_layer/team_seasons_2000_2026.csv (805 team-seasons from the league's stats service, retrieved June 2026) and data_layer/nba_games_2025_26.csv (every 2025-26 game from the league's game log). Charted and verified by chart_the_giveback.py, 103 asserts.For the league as a whole the difference is modest, because luck is small next to everything else that changes between seasons. The record as a whole carries over at 0.606, about the rate the parity piece found. A forecast built on it misses by 9.77 wins (root mean square) and explains 36.7% of the spread in next season's wins; one built on the two kinds of wins misses by 9.69 and explains 37.7%. The difference lives at the edges, which is where the Lakers and Charlotte sit this fall.
Where the luck lives
The site has every game of two of those seasons, 2023-24 and 2025-26, 1,230 of each; the 2023-24 In-Season Tournament final, which counts in no team's record, is left out. Across those 60 team-seasons, a team's net record in games decided by five points or fewer correlates with its luck at 0.56, so close games account for about 31% of the spread. The rest is how a margin gets spent. A 30-point rout moves the margin as much as six five-point wins and adds one win to the record.
Charlotte is the clean case. It went 5–11 in games decided by five or fewer and 26–11 in games decided by 15 or more: plenty of margin, too few of the wins that a few points decide. The Lakers ran the other way, 11–4 in the close games and 16–16 in the routs. The win-style piece read the same split in 2023-24 as a clue to how good a team was, and close games are rarer than they feel in the first place.
Is any of it skill?
A little, and it sticks to franchises. Luck repeats from one season to the next at r = 0.105 (in the franchise resamples, 0.02 to 0.18), at 0.035 two seasons apart and at 0.107 three apart. Across the 27 seasons the franchises' average luck spreads with a standard deviation of 0.81 wins, against 0.58 when each season's luck is shuffled among its teams; 10 of 10,000 shuffles spread as widely.
The Lakers sit at the top: +1.68 wins a season, ahead of their margin in 18 of 27 seasons, and in each of the last three by more than the season before. Minnesota is the mirror image at −1.83, ahead in 7. Whether that is late-game shot-making, the way a team plays out a rout, or chance that still looks like a pattern after 27 tries, the file cannot say. Either way it is small next to one season's luck. The Pythagorean piece said close-game records barely persist from one season to the next. Measured, that is about right.
Last season, team by team
Here is every team's 2025-26 record against its margin, worked from every game's score in the league's own log.
| Team | W–L | Points for | Points against | Pythagorean wins | Luck |
|---|---|---|---|---|---|
| Los Angeles Lakers | 53–29 | 116.3 | 114.6 | 45.3 | +7.7 |
| Milwaukee Bucks | 32–50 | 110.6 | 116.8 | 26.1 | +5.9 |
| Philadelphia 76ers | 45–37 | 115.9 | 116.1 | 40.6 | +4.4 |
| Sacramento Kings | 22–60 | 111.0 | 121.0 | 19.0 | +3.0 |
| Orlando Magic | 45–37 | 115.7 | 115.1 | 42.6 | +2.4 |
| Chicago Bulls | 31–51 | 116.3 | 121.5 | 28.9 | +2.1 |
| San Antonio Spurs | 62–20 | 119.8 | 111.5 | 59.9 | +2.1 |
| Brooklyn Nets | 20–62 | 105.9 | 115.9 | 18.2 | +1.8 |
| Portland Trail Blazers | 42–40 | 115.5 | 115.8 | 40.3 | +1.7 |
| Cleveland Cavaliers | 52–30 | 119.5 | 115.4 | 50.8 | +1.2 |
| Denver Nuggets | 54–28 | 122.1 | 116.9 | 52.9 | +1.1 |
| Washington Wizards | 17–65 | 112.9 | 124.9 | 16.2 | +0.8 |
| Phoenix Suns | 45–37 | 112.6 | 111.1 | 44.7 | +0.3 |
| Detroit Pistons | 60–22 | 117.8 | 109.6 | 59.9 | +0.1 |
| Minnesota Timberwolves | 49–33 | 118.0 | 114.6 | 49.1 | −0.1 |
| Utah Jazz | 22–60 | 117.6 | 126.0 | 22.7 | −0.7 |
| Atlanta Hawks | 46–36 | 118.5 | 116.0 | 46.8 | −0.8 |
| Oklahoma City Thunder | 64–18 | 119.0 | 107.9 | 65.4 | −1.4 |
| Houston Rockets | 52–30 | 115.2 | 110.0 | 53.8 | −1.8 |
| LA Clippers | 42–40 | 113.8 | 112.6 | 43.9 | −1.9 |
| Dallas Mavericks | 26–56 | 114.1 | 119.6 | 28.0 | −2.0 |
| Memphis Grizzlies | 25–57 | 114.7 | 120.7 | 27.0 | −2.0 |
| Toronto Raptors | 46–36 | 114.6 | 111.8 | 48.1 | −2.1 |
| Golden State Warriors | 37–45 | 114.6 | 115.2 | 39.6 | −2.6 |
| New York Knicks | 53–29 | 116.5 | 110.1 | 56.2 | −3.2 |
| Boston Celtics | 56–26 | 114.9 | 107.2 | 59.4 | −3.4 |
| Miami Heat | 43–39 | 120.9 | 118.5 | 46.5 | −3.5 |
| Indiana Pacers | 19–63 | 112.4 | 120.4 | 22.8 | −3.8 |
| New Orleans Pelicans | 26–56 | 115.5 | 120.0 | 30.4 | −4.4 |
| Charlotte Hornets | 44–38 | 116.0 | 111.2 | 52.8 | −8.8 |
Charlotte is the worked example. It scored 9,513 points and allowed 9,117. Divide what it allowed by what it scored: 9,117 ÷ 9,513 = 0.958373. Raise that to the 13.91 power: 0.5535. The expected winning percentage is 1 ÷ (1 + 0.5535) = .6437, and .6437 × 82 = 52.78 wins. Charlotte won 44, so its luck was 44 − 52.78 = −8.78 wins, one of the four largest shortfalls among the 805 team-seasons in the file.
Now the two forecasts. One built on the record alone carries 0.606 of every win: 16.16 + 0.606 × 44 = 42.8. The two-part version carries the margin's wins at 0.631 and the luck at 0.208: 15.13 + 0.631 × 52.78 − 0.208 × 8.78 = 15.13 + 33.30 − 1.83 = 46.6. They sit nearly four wins apart before anyone looks at a roster.
The Lakers run the other way. 9,396 ÷ 9,540 = 0.984906; to the 13.91 power, 0.8093; 1 ÷ 1.8093 = .5527, or 45.32 wins. They won 53, a gap of +7.68, one of the five largest on the lucky side in the file. The record says 16.16 + 0.606 × 53 = 48.3. The two-part forecast says 15.13 + 0.631 × 45.32 + 0.208 × 7.68 = 15.13 + 28.60 + 1.60 = 45.3, three wins lower. Two things pull on that number from outside the model. The Lakers' long habit of outrunning their margin argues for a smaller giveback than average. The continuity piece found them bringing back the smallest share of last season's minutes of any team, 42.4%, which argues for a bigger drop.
In general the two forecasts part company by 0.606 − 0.208 = 0.398 of a win for every win of luck, so for 17 of the 30 teams they land within a win of each other. Milwaukee (+5.86) and Philadelphia (+4.45) are next on the lucky side, New Orleans (−4.35) and Indiana (−3.79) on the other.
Pythagorean Win %: PF^13.91 / (PF^13.91 + PA^13.91). Enable JavaScript to use the interactive calculator, or try the calculators page.
The calculator above runs the same formula on points scored and allowed per game. Enter a row of the table and it returns that team's expected winning percentage, to within a few tenths of a win of the table, which works from season totals.
What this does not show
- Why the margin is the better guide. Pythagorean expectation describes how points usually turn into wins. The luck term is whatever it misses, and that includes things that are not luck in any everyday sense: how a team spends its margin in routs, how it closes games, and the franchise habit above. All of it together carries about a fifth of a win per win into the next season.
- Much about any one team. Next season's record moves for reasons neither number sees: trades, injuries, rookies, coaches. The two-part forecast explains 37.7% of the spread in next season's wins, and the rest is everything else.
- Exact figures for every season. The 27-season history uses the league's per-game points and margins, rounded to a tenth. That can move a team's luck by at most 0.16 wins, and no ranking above depends on it. Last season's figures come from every game's score, exactly.
- Home and away. The league's game log lists both teams as visitors in five 2025-26 games. They count in the records and point totals above, and nothing here depends on who was at home.
- A single, pre-registered test. One question went through several variants: two exponents, three lags, six groups, resamples and shuffles. They point the same way, but the third decimal deserves less weight than the direction.
- A forecast. The numbers for Charlotte and the Lakers are baselines built from last season's points and wins, not predictions.
Reproduce it
data_layer/build_games_2025_26.py turns the league's 2025-26 game log (LeagueGameLog via nba_api, cached in June 2026) into data_layer/nba_games_2025_26.csv, one row per game. It checks that every game appears twice with mirrored scores and that every team's wins and margin match the team file. chart_the_giveback.py computes every number above from that file, data_layer/team_seasons_2000_2026.csv and data_layer/nba_home_results.csv. It runs the 2,000 franchise resamples and the 10,000 shuffles on a fixed seed (20261009), pins each figure with an assert (103 in all), checks this page's text and table against the data, and draws the chart. Both scripts run offline from the bundled files.
The bottom line
A record is two numbers added together: the wins a team's margin earned and the wins it collected beyond that. The first kind carries a little under two-thirds of itself into the next season. The second carries about a fifth. Priced from the record, the Lakers start 5.5 wins ahead of Charlotte. Priced from the margin, Charlotte starts 1.3 ahead. Neither is a prediction, but only one of them reads the number that lasts.
Sources & Further Reading
- Team records, points and margins, 1999-00 to 2025-26: NBA.com/stats via nba_api (LeagueDashTeamStats, retrieved June 2026), bundled as
data_layer/team_seasons_2000_2026.csv. - Game scores: the league's 2025-26 game log (LeagueGameLog via nba_api, retrieved June 2026), bundled as
data_layer/nba_games_2025_26.csvbydata_layer/build_games_2025_26.py; every 2023-24 game from the bundleddata_layer/nba_home_results.csv. - The formula: Pythagorean expectation with the NBA exponent 13.91, as in the site's Pythagorean calculator and the Pythagorean piece.
- Related on this site: The Continuity Dividend, The Parity Pendulum, The Blowout Artist and the Grinder, How Often Is an NBA Game Actually Close? and How Many Wins Is a Net-Rating Point Worth?