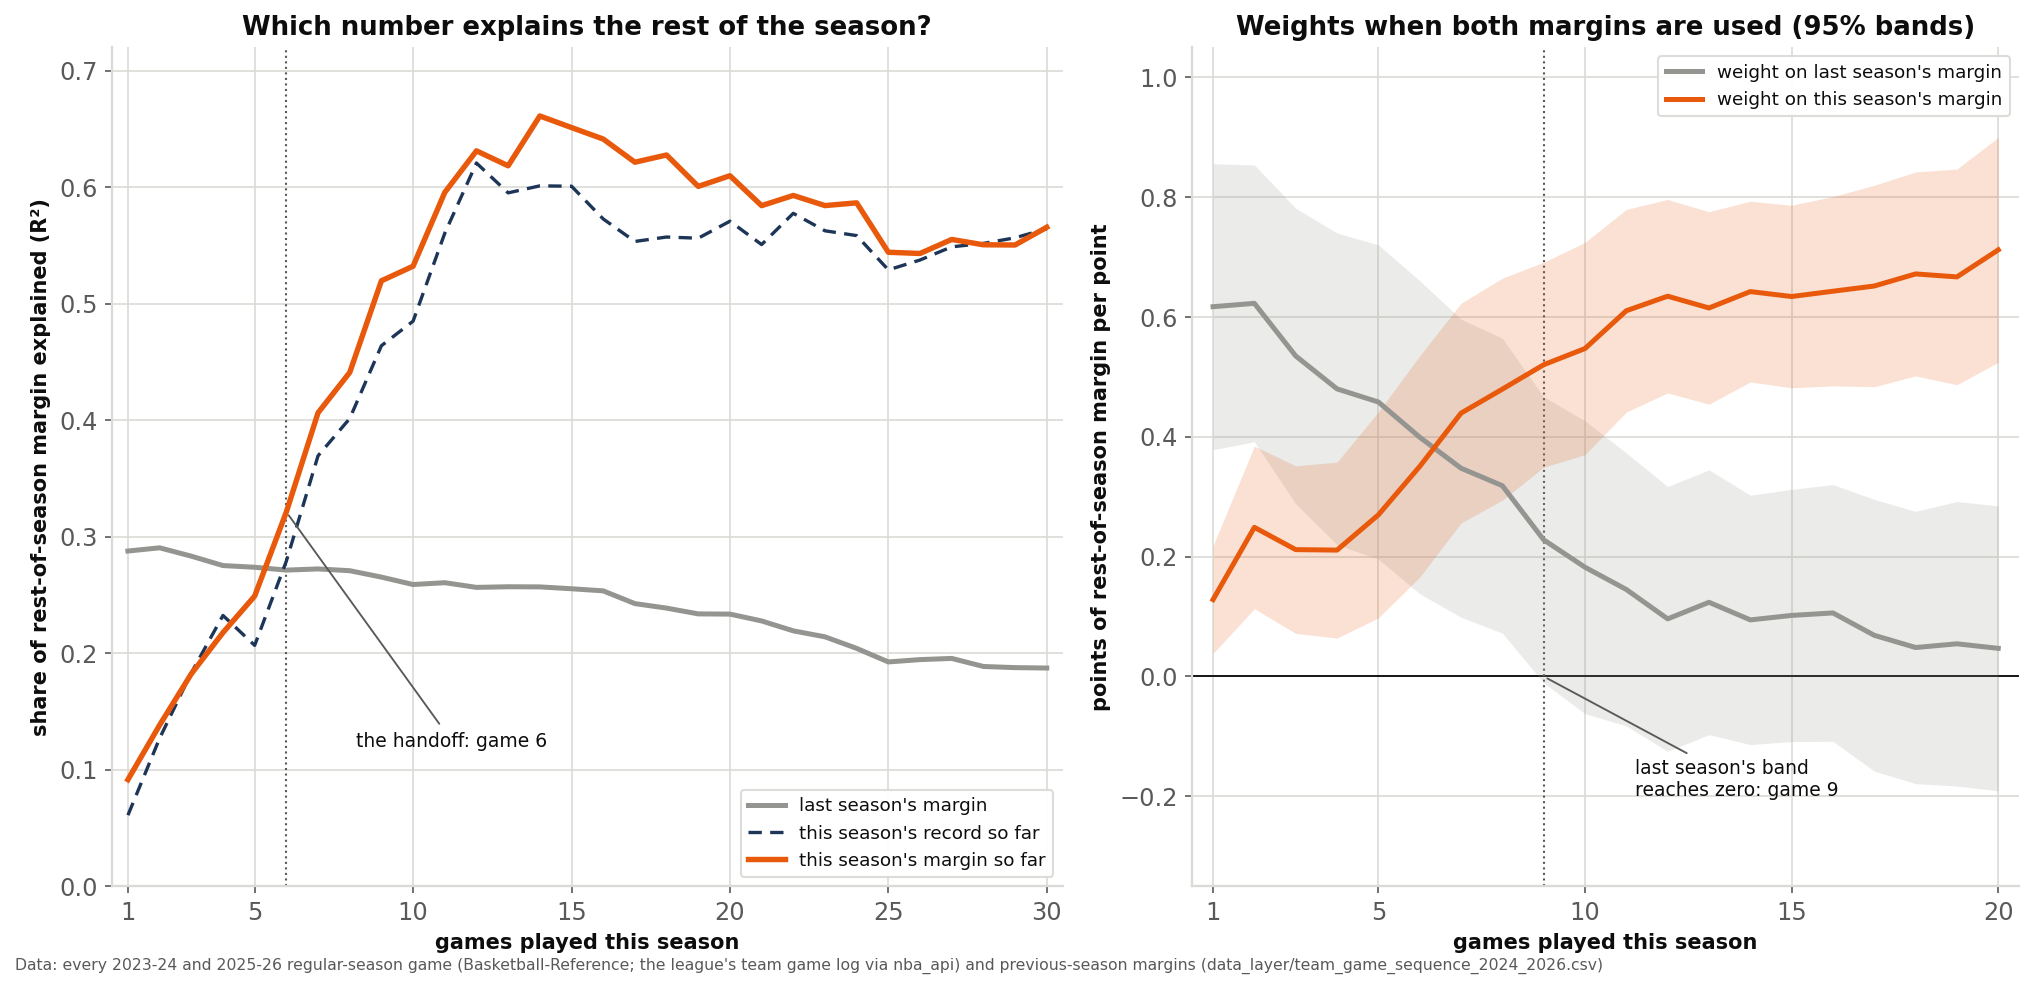
The regular season opens on Tuesday, October 20, and for the first week every team's record will be a handful of games. A reader who wants to know how good a team is has two numbers to choose from: last season's scoring margin, which rests on 82 games of a roster that has since changed, and this season's, which rests on a roster that is current and a sample that is tiny. We raced the two, game by game, across every team in the two seasons the site holds game by game. Last season's margin is the better guide to the rest of a season for a team's first five games. At game six the lead changes hands, and after game eight last season adds almost nothing you can measure. This season's record makes the same handoff at the same game, but its margin is the better of the two at 37 of 41 checkpoints.
The race
The site's files hold every regular-season game of 2023-24 and 2025-26 in date order, 82 per team (the 2023-24 In-Season Tournament final counted in no team's 82 and is left out). That is 60 team-seasons. For each one, after each of its first 41 games, we took three numbers: its average point margin so far, its winning percentage so far, and its margin per game the season before. Each was then asked to predict the same thing, the team's average margin over the rest of its season. The measure is the share of the spread in those rest-of-season margins that each number explains (R²). We also fitted the two margins together and read the weight each one earns, with its t-statistic.
Two checks guard against a lucky draw. The 60 team-seasons were resampled 2,000 times to see how far the handoff game moves. And each season was predicted from a model fitted on the other one, so the weights never see the games they are judged on.
Game by game
| After game | This season's margin | This season's record | Last season's margin | Both margins | Weight, this season | Weight, last season | Last season's t |
|---|---|---|---|---|---|---|---|
| 1 | 0.091 | 0.061 | 0.288 | 0.374 | 0.128 | 0.617 | 5.07 |
| 3 | 0.182 | 0.183 | 0.283 | 0.379 | 0.212 | 0.535 | 4.25 |
| 5 | 0.249 | 0.207 | 0.274 | 0.377 | 0.270 | 0.458 | 3.42 |
| 6 | 0.321 | 0.279 | 0.271 | 0.414 | 0.350 | 0.399 | 3.00 |
| 8 | 0.441 | 0.401 | 0.271 | 0.498 | 0.479 | 0.318 | 2.54 |
| 10 | 0.532 | 0.485 | 0.259 | 0.549 | 0.547 | 0.182 | 1.46 |
| 12 | 0.631 | 0.621 | 0.256 | 0.636 | 0.635 | 0.096 | 0.85 |
| 15 | 0.651 | 0.601 | 0.255 | 0.657 | 0.634 | 0.102 | 0.95 |
| 20 | 0.610 | 0.571 | 0.234 | 0.611 | 0.712 | 0.047 | 0.39 |
Last season's margin barely moves down the table: it explains 28.8% of the rest of the season after one game and 23.4% after twenty. This season's margin climbs fast, from 9.1% after one game to 44.1% after eight and 63.1% after twelve. The lines cross between games five and six: 24.9% against 27.4% after five games, 32.1% against 27.1% after six, and this season stays ahead at every checkpoint after that. Season by season the crossing came at game seven in 2023-24 and game six in 2025-26.
data_layer/team_game_sequence_2024_2026.csv (2023-24 results from Basketball-Reference; 2025-26 from the league's team game log, retrieved June 2026). Charted and verified by chart_the_handoff.py, 81 asserts.How sure is game six?
Not to the game. Resampling the 60 team-seasons 2,000 times puts the handoff anywhere from game 1 to game 9 (the middle 95% of resamples), with game 6 in the middle; in 92% of the resamples it came by game 8. Sixty team-seasons can place the handoff in the first two weeks. They cannot pin it to one night.
What last season adds once both margins are in the model is clearer. Its weight is 0.617 after one game (t = 5.07) and still 0.318 after eight (t = 2.54). From game nine on, its t-statistic stays below 2 at every checkpoint through game 41, and its weight drifts toward zero: 0.182 after ten games, 0.096 after twelve. Fitted together after eight games, the two margins explain 49.8% of the rest of the season against 44.1% for this season's margin alone.
Out of sample the picture is the same, with less certainty in the middle. Fitting on one season and predicting the other, the blend of both margins had the smallest error through game five in both directions: after five games, 4.25 points against 4.69 for this season's margin alone when predicting 2023-24, and 5.35 against 5.61 when predicting 2025-26. From game six to game ten the blend still won for 2023-24 but lost for 2025-26, where this season's margin alone was better (4.37 points against 4.64 after eight games). That is what a handoff looks like: before it, last season is worth having; after it, last season's help depends on the year.
Record or margin?
A team's record makes the same handoff, also at game six. It is the weaker of the two numbers, though not by much. This season's margin explained more of the rest of the season than this season's record at 37 of the 41 checkpoints; the record was ahead only after games 3, 4, 28 and 29. After ten games the margin explains 53.2% and the record 48.5%. The gap is the same one the Pythagorean piece finds at season's end: a record throws away how close the games were. Each point of margin was worth 2.33 wins over a full season in 2023-24, so the margin column is the one to convert.
Two teams after eight games
After eight games the fitted rule is: rest-of-season margin = −0.03 + 0.479 × this season's margin + 0.318 × last season's. In 2025-26 the median team played its eighth game on November 5. The two teams whose first eight games sat farthest from their previous season show what the rule does and where it falls short.
Houston, 2023-24. The Rockets had been outscored by 7.9 points a game in 2022-23. They opened 5-3, outscoring opponents by 5.50 a game. The rule: −0.03 + 0.479 × 5.50 + 0.318 × (−7.9) = −0.03 + 2.64 − 2.52 = +0.1. Over their remaining 74 games the Rockets went 36-38 and outscored opponents by 0.65 a game. This season's margin alone (fitted the same way) said +3.2 and last season's alone said −4.9; the blend beat both.
San Antonio, 2025-26. The Spurs had been outscored by 2.8 a game in 2024-25. They opened 6-2, +8.63 a game. The rule: −0.03 + 0.479 × 8.63 + 0.318 × (−2.8) = −0.03 + 4.13 − 0.89 = +3.2. The Spurs went 56-18 the rest of the way and outscored opponents by 8.27 a game. Here the rule was far too cautious: this season's margin alone said +5.1, closer but still short. A team that has genuinely changed looks, for eight games, exactly like a team on a hot streak, and the rule is built for the average of the two.
Across all 60 team-seasons after eight games, the typical miss (root-mean-square error) was 5.06 points a game for last season's margin alone, 4.43 for this season's margin alone and 4.20 for the two together.
Pace hands off later
The same race for pace runs on 2025-26 only, because the 2023-24 file has scores rather than box scores. Each game's possessions were estimated from the box score (field goal attempts plus 0.44 times free throw attempts, minus offensive rebounds, plus turnovers, averaged over the two teams and scaled to 48 minutes). That estimate runs higher than the league's published pace, 102.02 against 100.22 a game on average, but ranks the 30 teams almost identically (r = 0.991).
Pace does not hand off cleanly. This season's pace first edges ahead of last season's at game six, falls back behind at games seven and eight, and stays ahead only from game nine. More striking, last season's pace keeps adding to the forecast at every checkpoint through game 20 (t between 2.38 and 3.21), long after last season's margin has stopped. A team's tempo is a choice its coaches make and tend to keep, so last season's tempo stays informative longer than last season's quality does. The October Glass found the same kind of number, offensive rebounding, to be the one the preseason reads best. With 30 teams this is a pattern, not a measurement to the game; the pace explainer covers how possessions are counted.
Reading the first weeks
The NBA's schedule release has the 2026-27 season starting on Tuesday, October 20. In 2025-26, which began on October 21, the median team played its sixth game on November 1 and its tenth on November 9; in 2023-24, which began on October 24, those dates were November 4 and November 12. So until about the first of November, start from last season's margin and let the new one nudge it, using the weights in the table above. In the first days of November the two count about equally. By the middle of the month, a team's margin this season is close to the whole story, and a team still being judged on last year is being judged on the wrong year.
Last season's margin is also the right number to carry in, rather than last season's record: the Giveback found that wins a team's margin did not earn carry only 0.21 of a win into the next season. The Continuity Dividend measures how much a returning roster adds to that prior before a game is played.
What this does not show
- A precise handoff game. Game six is the best estimate from 60 team-seasons, and the resamples run from game 1 to game 9. The two seasons crossed at games seven and six.
- More than two seasons. The site holds game-by-game results for 2023-24 and 2025-26 only. More seasons could move the handoff a game or two either way.
- Schedule, home games or rest. An eight-game start can be five home games against weak teams. Nothing here adjusts for opponents or venue, which is one reason the early margin is noisier than it looks.
- Why a team changed. Trades, injuries and a new coach all move a team between seasons. The file sees only the scores. The Spurs' 2025-26 start and Indiana's (outscored by 7.88 a game over its first eight after a +2.2 season, and by 8.00 over the rest) are the kind of change the rule is slowest to accept.
- Late-season fine print. Past about game 22 last season's weight turns slightly negative, never with a t-statistic beyond 2 in size. That is noise on a shrinking target, and the advice above stops well before it.
Reproduce it
data_layer/build_game_sequence.py lays every team's 82 games of 2023-24 (from the bundled results file, Basketball-Reference) and 2025-26 (from the league's cached team game log, LeagueGameLog via nba_api, retrieved June 2026) out in date order, with last season's margin and pace from team_seasons_2000_2026.csv, and checks every team's wins and margin against that file. It writes data_layer/team_game_sequence_2024_2026.csv, 4,920 rows. chart_the_handoff.py checks the file again, runs the race at all 41 checkpoints, the 2,000 resamples on a fixed seed (20261016) and the cross-season fits, pins every figure above with an assert (81 in all), checks this page's text and table against the data, and draws the chart. Both run offline from the bundled files.
The bottom line
For the first five games of an NBA season, last season's margin is the better guide to a team. At game six the lead changes hands, and after game eight last season's margin adds nothing that survives a significance test. If 2026-27 runs on 2025-26's calendar, that puts the handoff around the first of November. Before then, start from last year and let the new margin nudge it. After it, trust this season's margin over its record, and over last year.
Sources & Further Reading
- 2025-26 game results and box scores: NBA.com/stats via nba_api (LeagueGameLog, team level, regular season, retrieved June 2026); 2023-24 game results: Basketball-Reference; previous-season margins and pace: the league's team stats (LeagueDashTeamStats). All bundled as
data_layer/team_game_sequence_2024_2026.csv. - The opening date: the NBA's 2026-27 regular-season schedule release (NBA Communications, read October 13, 2026), which has the season beginning on Tuesday, October 20.
- Related on this site: The Giveback, The Continuity Dividend, The October Glass, Pythagorean expectation, net rating to wins, how much of an NBA game is luck and pace and possessions.