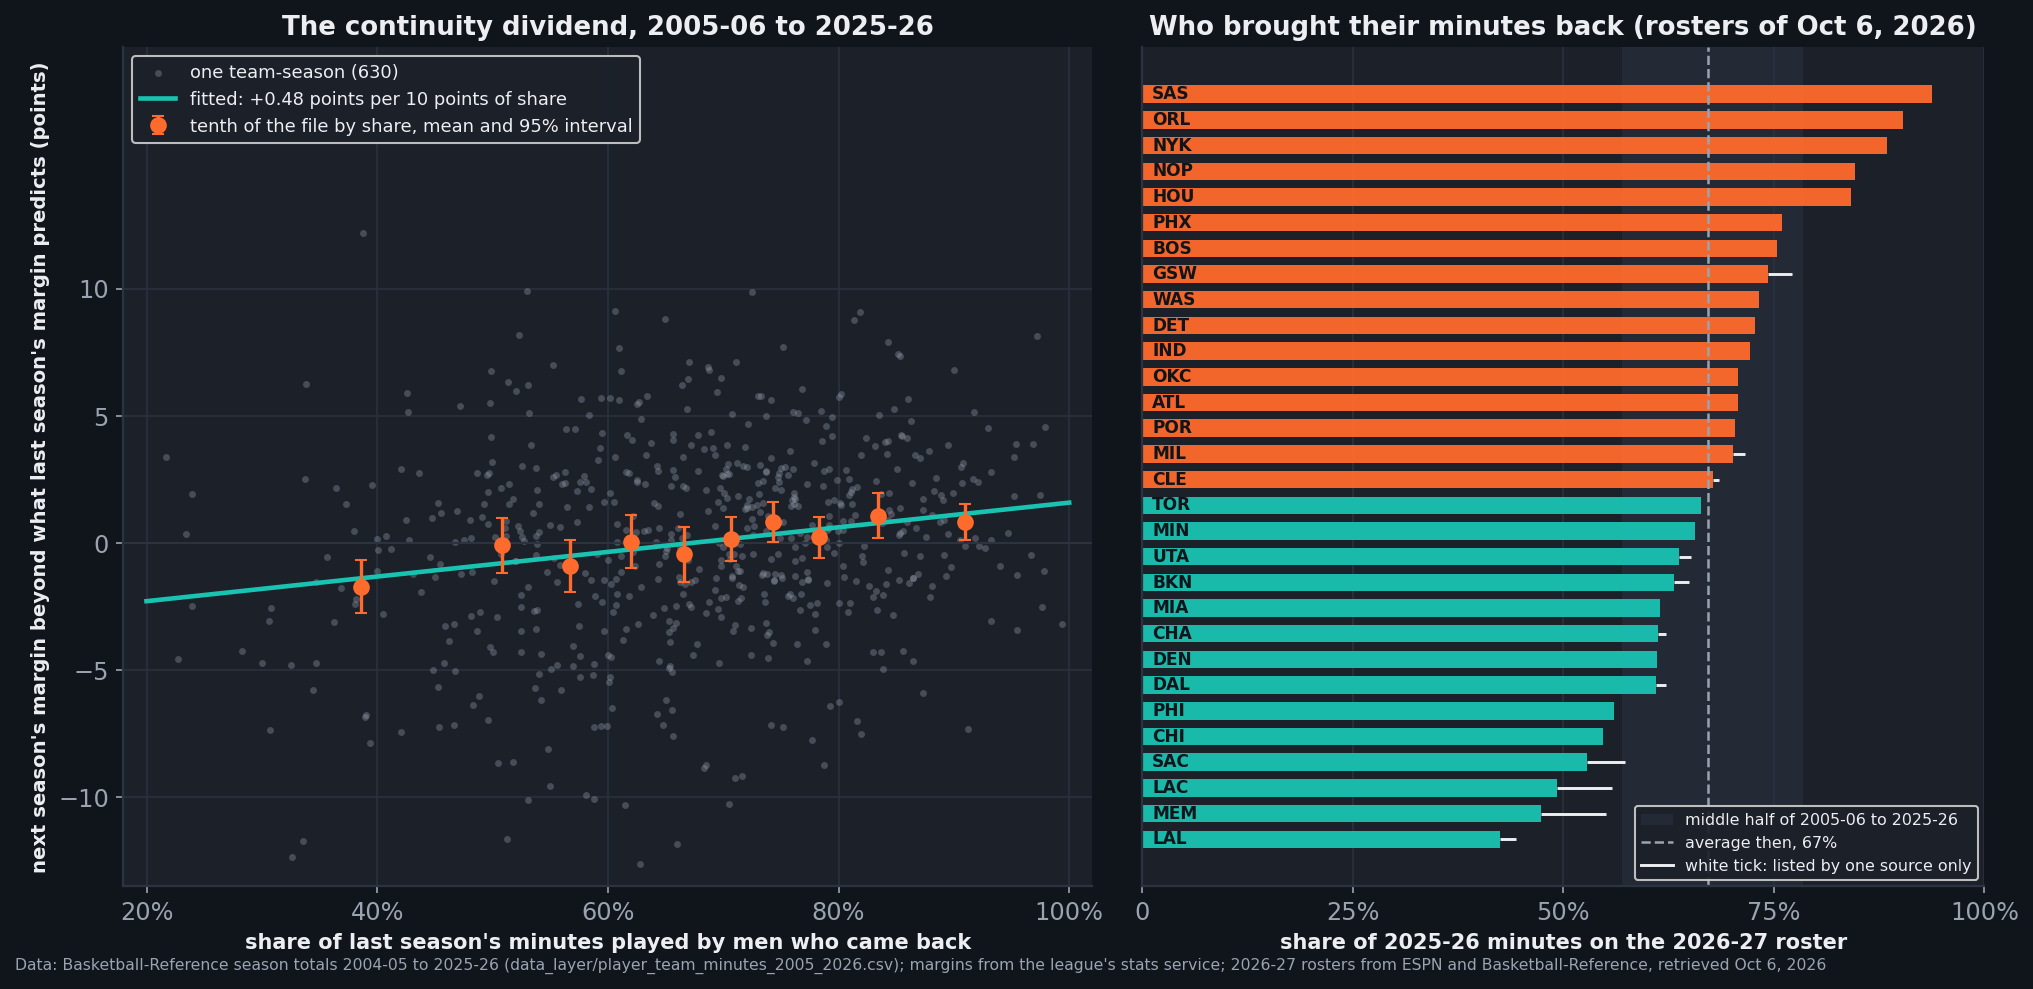
Every preseason the same advice comes round: trust last season's results, and trust them more for a team that kept its players. We gave that advice ourselves in the piece on whether preseason games predict anything, and declined to put a number on the second half because we had not run the regression. Here it is. Across 630 team-seasons since 2005-06, every ten points of last season's minutes that a team brings back is worth 0.48 points of scoring margin the next season, about 1.2 wins, on top of everything last season's margin already says. It is not youth in disguise, it does not come from players lost to season-long injuries, and it shows up in both halves of the file. It is also a nudge rather than a verdict. Last season's margin explains 35.3% of the spread in the next season's, and the returning share lifts that to 37.5%.
The claim, and the instrument
The preseason piece put it plainly: "the more of last year's minutes a team returns, the more last year's performance carries forward." Testing that needs two things this site's data layer did not have: every player's minutes for each team he played for, and a definition of continuity that is known in October.
The league's player file credits a traded player's whole season to his last team, which would hand a team minutes it never received. Basketball-Reference's season totals pages split him by team, so we rebuilt the minutes from those pages: 12,592 player-team rows over 22 seasons, 2004-05 to 2025-26, with 1,433 player-seasons split across two or more teams. Every team-season's minutes cover its games at 240 a game plus overtime, and the league's total minutes agree with the league's own player file to within 0.004% in every season.
The returning share is the part a reader can see before opening night: of all the minutes a team played last season, the share played by men who played for the same team again this season. Basketball-Reference publishes a better-known continuity figure that runs the other way, the share of this season's minutes played by men who were on last season's team. That one needs this season's minutes, so it only exists once the season has been played. We computed both. Ours reproduces Basketball-Reference's published figure for every team-season from 2005-06 to 2025-26 to the rounded percentage, 630 of 630, which is the check that the minutes are right.
Returning share minutes played last season by men who play for the team again ÷ all of the team's minutes last season
Across the 630 team-seasons the returning share averages 67.2% (median 69.0%), and the middle half of teams brought back between 57.0% and 78.5%. The summer of 2019 kept the least: teams going into 2019-20 returned 55.4% of their minutes on average, against 75.0% going into 2007-08. The two extremes cut against everything that follows. The 2012-13 Rockets brought back 21.7% of their minutes, the least in the file, and improved from +0.2 a game to +3.5. The 2015-16 Bulls brought back 99.4%, the most, and fell from +3.0 to −1.5.
What it is worth
The base model is the one every projection starts from: next season's point margin regressed on last season's. Across the 630 pairs a point of margin carries over at 0.61 (standard error 0.033), much the same rate the parity piece found for winning percentage, and margin alone explains 35.3% of the next season's spread.
Add the returning share and it earns its place. Its coefficient is 4.85 points of margin per unit of share (standard error 1.05), 4.62 standard errors from zero. That is easier to read in tens: every ten points of returning share is worth 0.48 points of margin. In the 568 full-length team-seasons in the file a point of margin is worth 2.53 wins (the points-to-wins piece does the same conversion for net rating), so ten points of share come to about 1.2 wins. The step from a team at the lower quartile of share (57.0%) to one at the upper quartile (78.5%) is 1.04 points of margin, 2.6 wins.
Model next margin = 0.560 × last margin + 4.85 × (returning share − 0.672) − 0.003
The coefficient on last season's margin drops from 0.61 to 0.560 when the share goes in, because good teams keep more of their players: the two correlate at 0.31. Part of what looked like margin carrying itself forward was continuity carrying it.
data_layer/player_team_minutes_2005_2026.csv (Basketball-Reference season totals, every player's minutes by team, retrieved June and October 2026), team margins from the league's stats service (data_layer/team_seasons_2000_2026.csv), 2026-27 rosters from ESPN and Basketball-Reference retrieved October 6, 2026. Charted and verified by chart_the_continuity_dividend.py, 92 asserts.It is not youth
The obvious suspect is age. Young teams keep their players because rookie contracts keep them, and young players improve, as the sophomore-leap piece found when it matched year-two players against others the same age. If continuity were youth in disguise, it would add nothing a reader could not get from the roster's birthdays.
The file says otherwise. Minutes-weighted age, using Basketball-Reference's age on February 1 of each season, averages 26.48, and it barely correlates with the returning share at all: r = −0.07. Age goes with margin instead (r = 0.49), because good teams are older. Put both into the model and each keeps an effect of its own. On its own, a year of minutes-weighted age costs −0.45 points of next season's margin (standard error 0.102). Next to the returning share it costs −0.35 a year (standard error 0.105), and the share's coefficient is 3.91 (standard error 1.08), 81% of what it was without age. A roster a year older than average gives back about a third of a point; one with ten more points of returning share gains about four-tenths. They are separate levers, and they pull in opposite directions.
Does it make last season count for more?
The original claim was narrower than a bonus. It said continuity makes last season carry forward, which is a claim about the slope: a high-continuity team's margin should carry over at a higher rate than a low-continuity team's. Split the 630 pairs into thirds by returning share and the carry-over runs 0.47 (standard error 0.07) for the third that brought back between 21.7% and 60.9%, 0.59 (0.06) for the middle third, and 0.64 (0.05) for the third that brought back 74.8% or more.
That is the direction the claim predicted, but the size is less certain. Fitted as a single interaction term, the slope rises by 0.434 per unit of share with a standard error of 0.217. That is two standard errors, the kind of result one more season of data could move.
The bonus is the firmer half of the story. Fit it separately by how good teams were the season before, and the share's coefficient is positive in every band. It is 3.78 for teams below −4 a game (standard error 2.55), 3.53 for −4 to 0 (2.12) and 4.30 for 0 to +4 (1.81). For teams at +4 or better it is 7.99 (2.13), or 0.80 points per ten points of share. Continuity is worth something to everyone and probably most to good teams. That is what one would expect if the players a good team loses are better than the ones it finds to replace them. The bands are too noisy to say by how much. Nor is there any sign that turning over a bad roster speeds the climb the climb-and-slide piece measured: for teams more than four points a game below average the coefficient is positive too, if noisy.
Does it hold up?
- Against chance. Shuffling the returning shares among teams within each season, 5,000 times, never produced a coefficient as large as 4.85. The 99.9th percentile of the shuffles was 3.24.
- Against franchise clustering. Each franchise appears 21 times, so the pairs are not independent. Resampling whole franchises 2,000 times puts the 95% interval at 2.20 to 7.41: wider than the standard error implies, and still clear of zero.
- Against season-long absences. The share counts a player as back only if he played for the team again, so a man who spent the whole next season injured counts as gone, and an injury like that also costs margin. On average 6.4% of a team's minutes belonged to players who did not play anywhere in the league the next season: retired, abroad, or out all year. Leave those minutes out and the coefficient is 4.51 (standard error 1.02). Add their share to the model as a term of its own and it contributes nothing.
- Across eras. The coefficient is 4.11 (standard error 1.45) for 2005-06 to 2015-16 and 5.56 (1.55) for 2016-17 to 2025-26.
- In wins instead of margin. With winning percentage on both sides of the model the coefficient is 0.141 (standard error 0.033): 1.2 wins per ten points of share, the same answer.
- Against the after-the-season figure. Swap in Basketball-Reference's continuity, measured on next season's minutes, and the coefficient is 8.30 (standard error 1.01), 71% larger. That number partly measures the season it is predicting: when returning players miss time, continuity falls and so does the margin. It is the reason to use the October version in October.
This fall's rosters
The returning share can be read off a roster, and the preseason rosters are out. We took every team's preseason roster on October 6 from two sources, ESPN's team roster service (607 players) and Basketball-Reference's 2026-27 team pages (601). Basketball-Reference's player links carry the same ids as its totals pages; ESPN's names were matched to them, and 478 ESPN players matched a 2025-26 season. Of the 31 ESPN players with NBA experience who did not match at first, a last-name search of every 2025-26 row found one spelling difference (Ronald Holland II, listed as Ron Holland) and 30 players who did not play in the league last season. The two sources agree to the minute on 12 teams. Where they differ it is over fringe and two-way players, and never by eight points of share. Below, a player counts as back only when both sources list him.
San Antonio is the clean worked example, because the two sources agree on its roster exactly. The Spurs played 19,730 minutes in 2025-26. Of those, 18,498 were played by men on both 2026-27 rosters. The 1,232 that are not belong to eight players, led by Kelly Olynyk (360), Jeremy Sochan (358), Lindy Waters III (285) and Bismack Biyombo (141). That is a returning share of 18,498 ÷ 19,730 = 93.8%, the highest in the league this fall and above all but 15 of the 630 team-seasons in the file. Against the historical average of 67.2% it is worth 4.85 × 0.265 = +1.29 points of margin, about 3.3 wins.
The full baseline uses all three numbers. San Antonio finished 2025-26 at +8.3 a game with a minutes-weighted age of 25.4, a year younger than the file's average of 26.48. Margin alone says +5.0 next season (0.608 × 8.3). With the share and age added, using the coefficients from the age section, it says 0.631 × 8.3 + 3.91 × 0.265 + 0.346 × 1.08, or 5.2 + 1.0 + 0.4 = +6.6, about 4 wins more than the margin alone implies. That is a baseline built from three numbers, not a forecast: it knows nothing about who the new players are or who stays healthy.
At the other end, the Lakers have 42.4% of last season's minutes on both rosters (44.3% counting Basketball-Reference's list alone), worth −1.20 points against an average roster. Between the top and the bottom of this fall's list, continuity alone is worth about 6.3 wins. The league as a whole brought back 68.0% on the both-sources count, a little above the historical 67.2%; five teams are above the old upper quartile and six are below the lower one.
| Team | 2025-26 margin | Back (both) | ESPN | B-Ref | Effect |
|---|---|---|---|---|---|
| San Antonio Spurs | +8.3 | 93.8% | same | same | +1.29 |
| Orlando Magic | +0.6 | 90.3% | 90.4% | same | +1.12 |
| New York Knicks | +6.3 | 88.5% | same | same | +1.03 |
| New Orleans Pelicans | −4.5 | 84.6% | same | same | +0.84 |
| Houston Rockets | +5.2 | 84.1% | same | same | +0.82 |
| Phoenix Suns | +1.5 | 76.0% | 76.2% | same | +0.42 |
| Boston Celtics | +7.7 | 75.4% | same | same | +0.39 |
| Golden State Warriors | −0.6 | 74.3% | 77.2% | same | +0.34 |
| Washington Wizards | −12.0 | 73.3% | same | same | +0.29 |
| Detroit Pistons | +8.2 | 72.8% | 72.9% | same | +0.27 |
| Indiana Pacers | −8.0 | 72.2% | same | same | +0.24 |
| Oklahoma City Thunder | +11.1 | 70.8% | same | same | +0.17 |
| Atlanta Hawks | +2.4 | 70.7% | 71.0% | same | +0.17 |
| Portland Trail Blazers | −0.3 | 70.4% | 70.6% | same | +0.15 |
| Milwaukee Bucks | −6.2 | 70.2% | 71.5% | same | +0.14 |
| Cleveland Cavaliers | +4.1 | 67.8% | 68.5% | same | +0.03 |
| Toronto Raptors | +2.8 | 66.3% | same | same | −0.04 |
| Minnesota Timberwolves | +3.4 | 65.6% | 66.0% | same | −0.08 |
| Utah Jazz | −8.4 | 63.8% | 65.2% | same | −0.17 |
| Brooklyn Nets | −10.0 | 63.2% | 64.9% | same | −0.20 |
| Miami Heat | +2.3 | 61.5% | same | 61.8% | −0.28 |
| Charlotte Hornets | +4.8 | 61.2% | 62.2% | same | −0.29 |
| Denver Nuggets | +5.1 | 61.1% | same | same | −0.30 |
| Dallas Mavericks | −5.5 | 61.0% | 62.3% | same | −0.30 |
| Philadelphia 76ers | −0.2 | 56.1% | same | same | −0.54 |
| Chicago Bulls | −5.2 | 54.7% | same | same | −0.61 |
| Sacramento Kings | −10.0 | 52.8% | 57.4% | 54.9% | −0.70 |
| LA Clippers | +1.1 | 49.2% | same | 55.8% | −0.87 |
| Memphis Grizzlies | −6.0 | 47.4% | 55.0% | same | −0.96 |
| Los Angeles Lakers | +1.8 | 42.4% | same | 44.3% | −1.20 |
Two cautions apply to this table more than to the history. These are preseason rosters, so the shares will move a little before opening night as camp contracts are cut and late signings land. And the effect column treats every newcomer as the average newcomer of the last 21 seasons. A team that refilled its minutes with an established star is not average, and nothing in this table can see that.
What this does not show
- Why continuity pays. Three explanations fit. Players who know each other may play better together. A team that has to refill minutes may refill them, on average, with worse players: rookies, or the end of someone else's bench. Or a team that lets its veterans go in July is often choosing a worse season. The file cannot separate the three. The larger effect for good teams leans towards the second, but it does not settle it.
- Much about any one team. With margin, share and age in the model, 38.5% of the spread in next season's margin is explained; the rest is health, development, trades and luck. The 2012-13 Rockets and 2015-16 Bulls are the reminder.
- Identical measures. The historical share counts a player as back if he played for the team again; this fall's counts him as back if he is on the roster. A player traded at the deadline counts as back in both, because he was there in October. A man who will miss all of 2026-27 counts as back in the table and would have counted as gone in the history.
- A pre-registered result. We ran one question through a dozen variants: thirds, bands, eras, two outcomes, two definitions of continuity, a shuffle and a resample. Every variant points the same way, but the p-values are not the ones a single pre-registered test would give. Lean on the direction and the rough size, not on the third decimal.
Reproduce it
data_layer/build_roster_continuity.py fetches and caches the 22 Basketball-Reference totals pages, its continuity page and both roster sources, checks that every traded player's team rows add up to his season total, and writes the four bundled files (player_team_minutes_2005_2026.csv, br_continuity_2006_2026.csv, rosters_2026_10_06.csv and rosters_2026_10_06_bref.csv). chart_the_continuity_dividend.py computes every number above from them, runs the 5,000 shuffles and 2,000 franchise resamples on a fixed seed (20261006), pins each figure with an assert (92 in all), checks this page's text and table against the data, and draws the chart. The chart script runs offline from the bundled files.
The bottom line
The preseason piece said that continuity compounds last season's results and stopped short of saying by how much. It does, though not quite in the way it said. The extra carry-over for high-continuity teams points the right way but sits only two standard errors from nothing. The firmer finding is a dividend: about half a point of margin, 1.2 wins, for every ten points of last season's minutes that come back, on top of the margin itself and separate from age, and most clearly for good teams. Last season's margin is still the number that matters most in October. How much of the roster came back is the second, and how old it is the third.
Sources & Further Reading
- Player minutes by team: Basketball-Reference season totals, 2004-05 to 2025-26 (one page per season; retrieved October 6, 2026, the 2015-16 page in June 2026), bundled as
data_layer/player_team_minutes_2005_2026.csvbydata_layer/build_roster_continuity.py. - The after-the-season check: Basketball-Reference roster continuity, retrieved October 6, 2026, bundled as
data_layer/br_continuity_2006_2026.csv. - Team margins and records: NBA.com/stats via nba_api (LeagueDashTeamStats, retrieved June 2026), bundled as
data_layer/team_seasons_2000_2026.csv; league player minutes for the cross-check fromdata_layer/player_seasons_2005_2026.csv(retrieved September 2026). - 2026-27 rosters: ESPN's public team roster service and Basketball-Reference's 2026-27 team pages, both retrieved October 6, 2026, bundled as
data_layer/rosters_2026_10_06.csvanddata_layer/rosters_2026_10_06_bref.csv. - Related on this site: Does Preseason Performance Predict Anything?, The Parity Pendulum, The Climb and the Slide, The Sophomore Leap and How Many Wins Is a Net-Rating Point Worth?