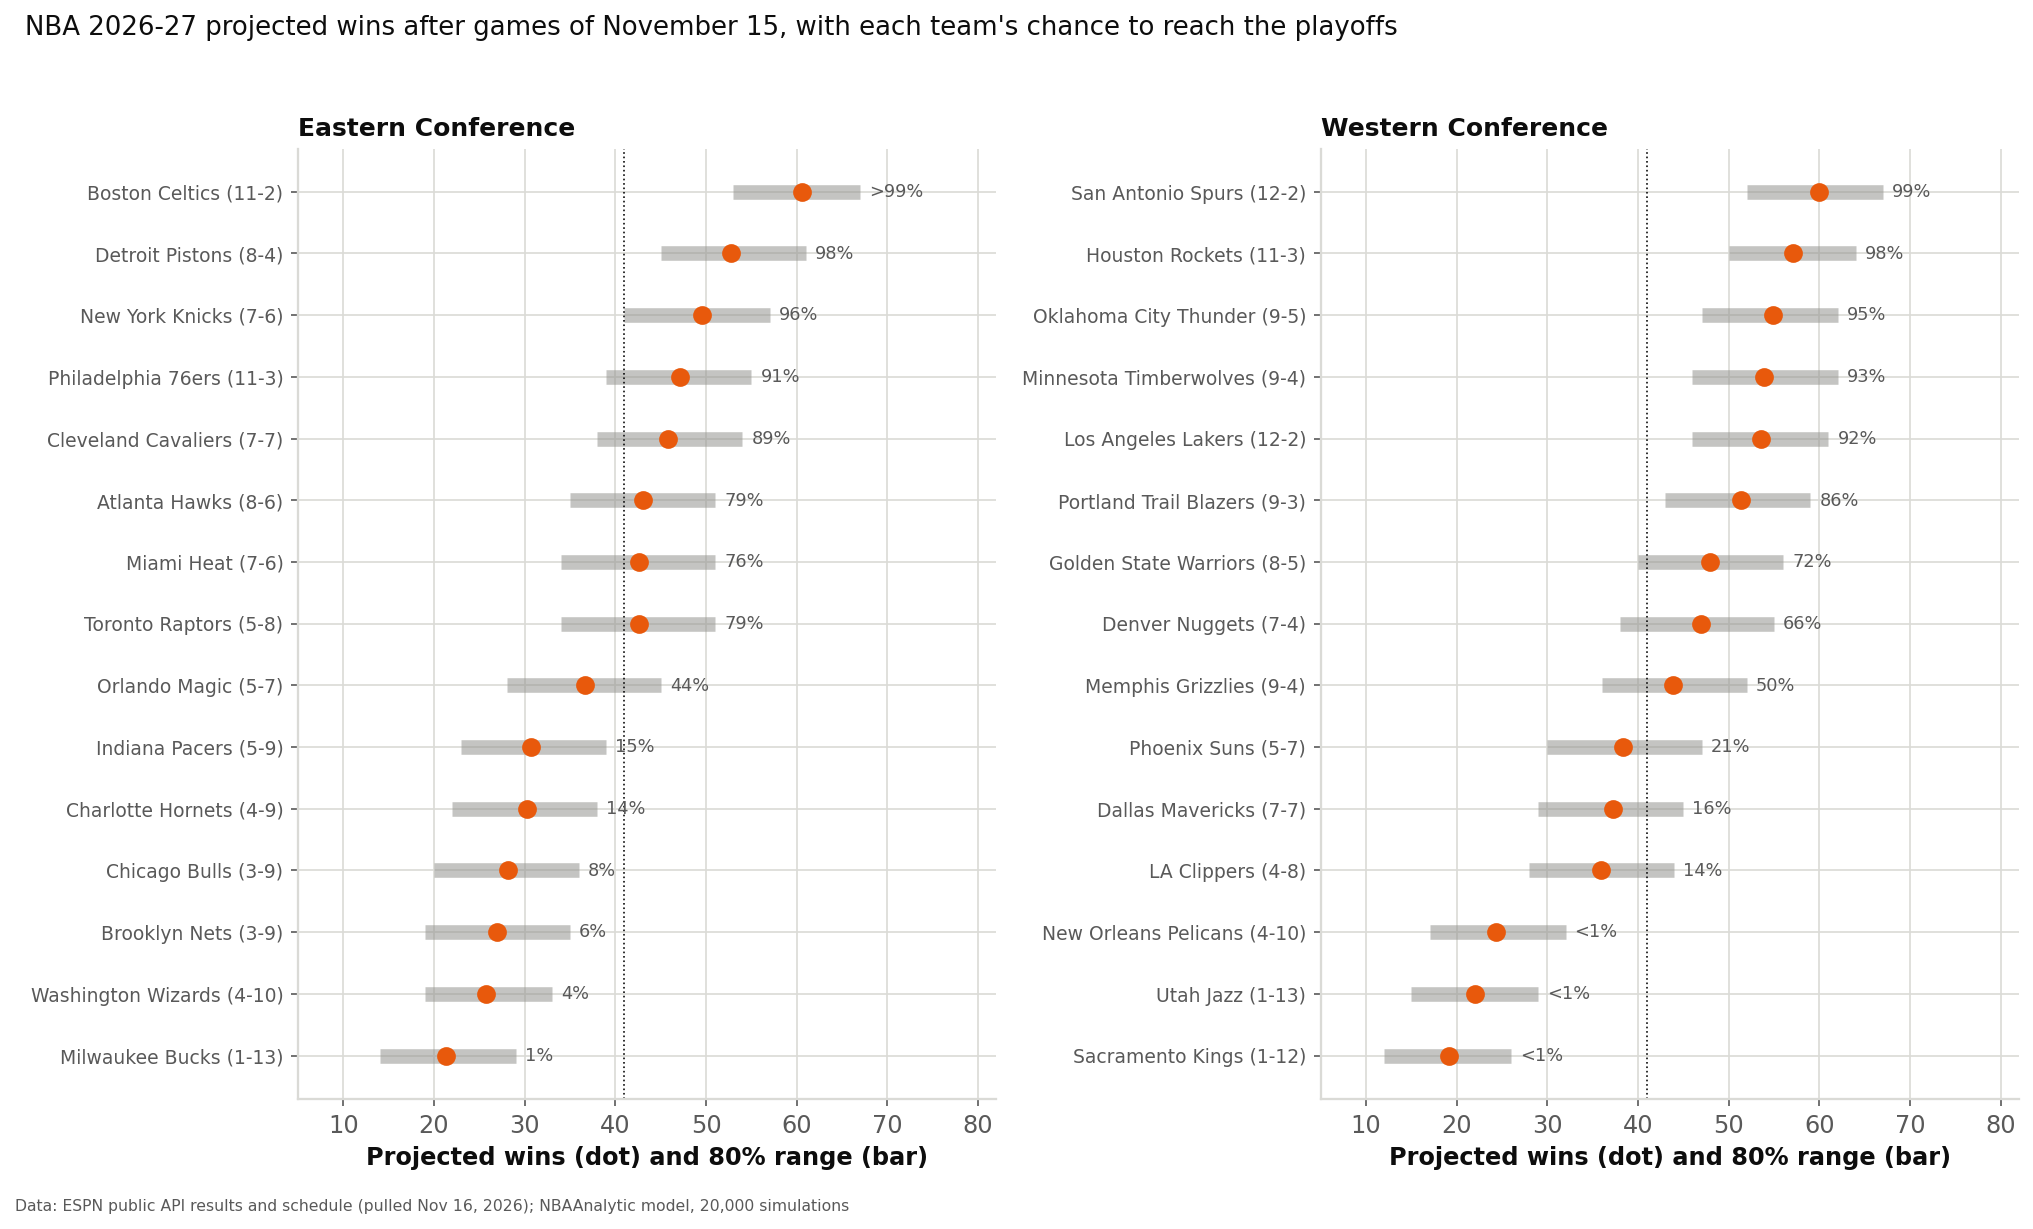
Four weeks into the 2026-27 season, every team has played between 11 and 14 games, and the standings already say a good deal and not nearly everything. This page turns them into a forecast the way a statistician would: a rating for each team built from its scoring margin, pulled toward a prior from last season, simulated through the 1,003 games still on the schedule 20,000 times. The result is a projected final record for all 30 teams with an 80% range, and each team's chance of a top-six seed, a play-in place and a playoff spot. The model is then tested on five past seasons, cut at the same point of the season, against simpler forecasts, and its probabilities are checked for calibration. At this point of a season it misses teams' final win counts by 6.0 on average, against 7.9 for the current winning percentage and 8.8 for last season's.
The projections
Results run through Sunday, November 15: 197 games. Each projected win figure is the average over 20,000 simulated seasons; the range holds the middle 80% of them. "Top six" is a guaranteed playoff seed, "play-in" is finishing seventh to tenth, and "playoffs" adds the play-in games, simulated with the same ratings.
| Team | Record | Margin per game | Rating | Projected wins | 80% range | Top six | Play-in | Playoffs |
|---|---|---|---|---|---|---|---|---|
| Boston Celtics | 11-2 | +13.2 | +8.2 ± 2.8 | 60.6 | 53–67 | >99% | <1% | >99% |
| Detroit Pistons | 8-4 | +5.4 | +4.9 ± 2.9 | 52.8 | 45–61 | 94% | 6% | 98% |
| New York Knicks | 7-6 | +5.9 | +4.3 ± 2.8 | 49.5 | 41–57 | 86% | 13% | 96% |
| Philadelphia 76ers | 11-3 | +2.1 | +0.9 ± 2.8 | 47.1 | 39–55 | 76% | 23% | 91% |
| Cleveland Cavaliers | 7-7 | +1.6 | +2.1 ± 2.8 | 45.8 | 38–54 | 70% | 29% | 89% |
| Atlanta Hawks | 8-6 | +1.7 | +0.5 ± 2.8 | 43.0 | 35–51 | 51% | 45% | 79% |
| Miami Heat | 7-6 | −1.2 | +0.1 ± 2.8 | 42.6 | 34–51 | 49% | 46% | 76% |
| Toronto Raptors | 5-8 | +1.0 | +1.5 ± 2.8 | 42.6 | 34–51 | 49% | 46% | 79% |
| Orlando Magic | 5-7 | −4.4 | −2.2 ± 2.9 | 36.6 | 28–45 | 17% | 59% | 44% |
| Indiana Pacers | 5-9 | −2.4 | −4.6 ± 2.8 | 30.7 | 23–39 | 3% | 38% | 15% |
| Charlotte Hornets | 4-9 | −10.8 | −4.7 ± 2.8 | 30.2 | 22–38 | 3% | 35% | 14% |
| Chicago Bulls | 3-9 | −11.3 | −5.9 ± 2.9 | 28.2 | 20–36 | 1% | 25% | 8% |
| Brooklyn Nets | 3-9 | −6.2 | −6.1 ± 2.9 | 26.9 | 19–35 | 1% | 18% | 6% |
| Washington Wizards | 4-10 | −7.4 | −7.3 ± 2.8 | 25.7 | 19–33 | <1% | 13% | 4% |
| Milwaukee Bucks | 1-13 | −13.6 | −8.3 ± 2.8 | 21.3 | 14–29 | <1% | 4% | 1% |
| Team | Record | Margin per game | Rating | Projected wins | 80% range | Top six | Play-in | Playoffs |
|---|---|---|---|---|---|---|---|---|
| San Antonio Spurs | 12-2 | +12.9 | +8.4 ± 2.8 | 59.9 | 52–67 | 96% | 4% | 99% |
| Houston Rockets | 11-3 | +10.1 | +7.1 ± 2.8 | 57.1 | 50–64 | 91% | 9% | 98% |
| Oklahoma City Thunder | 9-5 | +5.1 | +6.5 ± 2.8 | 54.9 | 47–62 | 84% | 16% | 95% |
| Minnesota Timberwolves | 9-4 | +11.5 | +6.5 ± 2.8 | 53.9 | 46–62 | 78% | 21% | 93% |
| Los Angeles Lakers | 12-2 | +7.9 | +4.7 ± 2.8 | 53.6 | 46–61 | 78% | 22% | 92% |
| Portland Trail Blazers | 9-3 | +7.8 | +4.3 ± 2.9 | 51.3 | 43–59 | 64% | 34% | 86% |
| Golden State Warriors | 8-5 | +4.3 | +2.9 ± 2.8 | 47.9 | 40–56 | 42% | 52% | 72% |
| Denver Nuggets | 7-4 | +1.8 | +2.5 ± 2.9 | 46.9 | 38–55 | 36% | 55% | 66% |
| Memphis Grizzlies | 9-4 | +8.9 | +1.3 ± 2.8 | 43.9 | 36–52 | 21% | 62% | 50% |
| Phoenix Suns | 5-7 | −4.7 | −0.9 ± 2.9 | 38.3 | 30–47 | 5% | 48% | 21% |
| Dallas Mavericks | 7-7 | −2.5 | −2.0 ± 2.8 | 37.2 | 29–45 | 3% | 41% | 16% |
| LA Clippers | 4-8 | −4.2 | −1.5 ± 2.9 | 35.9 | 28–44 | 2% | 34% | 14% |
| New Orleans Pelicans | 4-10 | −9.1 | −7.1 ± 2.8 | 24.3 | 17–32 | <1% | 1% | <1% |
| Utah Jazz | 1-13 | −10.9 | −7.2 ± 2.8 | 22.0 | 15–29 | 0% | 1% | <1% |
| Sacramento Kings | 1-12 | −13.5 | −9.1 ± 2.8 | 19.2 | 12–26 | 0% | <1% | <1% |
The two tables are not the standings re-sorted. Philadelphia is 11-3 but has outscored its opponents by only 2.1 points a game, so the model rates it as a 47-win team. Memphis is 9-4 on a much bigger margin, +8.9, but started from a prior of −3.7 and has played a soft schedule, so it lands at 44 wins and an even chance of the playoffs. Milwaukee's 1-13 start, on a margin of −13.6, has taken it from a below-average prior to the bottom of the East.
The model
The model is a standard margin rating, the same idea behind net rating and the Pythagorean standings, with two additions that matter early in a season: a prior and a stated amount of noise. For a game between a home team H and an away team A:
Margin home points − away points = h + rH − rA + e, e ~ Normal(0, σ²)
- r is a team's rating in points per game against an average opponent on a neutral floor.
- h is home-court advantage, in points. It is dropped for the rare neutral-site game.
- σ = 13.69 points is how far a single game's margin strays from what the two ratings say. It is the average, over the five past seasons, of the scatter left after fitting full-season ratings to every game.
- The prior. Before a game is played, each rating is centred on ρ times last season's margin per game (measured from the league average), with ρ = 0.610. That is the least-squares slope of a team's margin on its previous season's margin across 766 pairs of seasons from 2000-01 to 2025-26, the same carry-over that The Giveback and The Handoff measured in other ways. Home court starts at 1.95 points, the five seasons' average.
- The shrinkage, τ = 4.0 points. The prior is Normal with this standard deviation: how far a team's true rating is allowed to sit from its prior before the evidence has to argue for it. τ was not assumed. It was picked from a grid of ten settings (2.0 to 8.0) as the one whose rest-of-season game forecasts had the lowest log loss in the past seasons.
Because every piece is Normal, the fit is exact rather than iterative: the ratings have a Normal posterior whose mean and covariance come from one matrix solve, the same arithmetic as ridge regression with the prior as the target. The posterior mean has a readable form. A team's rating is a weighted average of two things:
Rating w × schedule-adjusted margin + (1 − w) × prior, w = n / (n + σ²/τ²)
where n is games played and the schedule-adjusted margin takes out home court and adds back the average rating of the opponents. With σ = 13.69 and τ = 4.0, σ²/τ² = 11.7: a team's own games and its prior carry equal weight after about 12 games, which is roughly where the league is now. The posterior home-court advantage this season is 2.05 points.
A worked example: Memphis
Memphis has played 13 games and outscored its opponents by 8.92 points a game. It played one more home game than road game, worth 2.05 ÷ 13 = 0.16 points a game, and its opponents' average rating is −3.06. Its schedule-adjusted margin is therefore 8.92 − 0.16 − 3.06 = +5.70 (+5.71 before rounding). The weight on it is 13 ÷ (13 + 11.72) = 0.526. Its prior, 0.610 times last season's margin measured from the league average, is −3.65. So the rating is
Memphis 0.526 × 5.71 + 0.474 × (−3.65) = 3.00 − 1.73 = +1.27
a little better than an average team, which over the remaining schedule comes to 43.9 wins. Boston works the same way from a much stronger start: +13.15 a game, +11.41 adjusted, a prior of +4.70, and a rating of +8.23, the best in the East.
The simulation
A rating with no uncertainty would overstate what anyone knows in November, so the simulation carries two kinds of it. Once per simulated season it draws all 30 ratings and home court together from their posterior, which keeps the rating uncertainty, about 2.8 points per team right now, correlated across teams the way the data leaves it. Then it plays every remaining game: each margin is the two ratings plus home court plus a Normal draw with σ = 13.69, and the home team wins if the margin is positive.
Three details complete a season. Each team has 80 dated games; the other two, which the league assigns from December 4 to 10 according to the NBA Cup group results, are simulated as two rounds of random pairings on a neutral floor, so every simulated season still holds 1,230 wins. Seeds are set by wins within each conference, with ties broken at random rather than by the league's tiebreakers. And the play-in is played out: seventh hosts eighth, ninth hosts tenth, and the loser of the first game hosts the winner of the second for the eighth seed.
A short sketch of the core, in Python with NumPy (the full script also handles the prior, the play-in and the backtest):
import numpy as np

# X: one row per game played, +1 home team, -1 away team, last column 1 for home court
# y: home margin; mu: prior means (30 ratings, then home court); prec: prior precisions
A = X.T @ X / sigma**2 + np.diag(prec)
C = np.linalg.inv(A)                       # posterior covariance
m = C @ (X.T @ y / sigma**2 + prec * mu)   # posterior mean

rng = np.random.default_rng(20261116)
L = np.linalg.cholesky(C)
for s in range(20000):
    theta = m + L @ rng.standard_normal(31)          # one draw of every rating + home court
    r, h = theta[:30], theta[30]
    margin = h * home_flag + r[home] - r[away] + sigma * rng.standard_normal(len(home))
    wins = wins_so_far.copy()
    np.add.at(wins, home, margin > 0)
    np.add.at(wins, away, margin <= 0)
    # ... the two December games, seeding, the play-in
The backtest
A forecast deserves trust only if it has worked before. The test reruns the whole procedure on the five complete seasons from 2021-22 to 2025-26, each cut 27 days after its own opening night, the same point as today (teams had played 12.9 to 13.5 games on average at those cuts). Nothing about the test season was used to forecast it: ρ is fitted without that season's pair, and σ, home court and τ come from the other four seasons. The forecasts are then compared with each team's actual final wins.
| Forecast | Average miss (wins) | Root mean square miss |
|---|---|---|
| This model | 6.01 | 7.33 |
| Current win percentage × 82 | 7.86 | 9.90 |
| The model's prior alone (no games of the season seen) | 8.32 | 10.18 |
| Wins so far, then .500 the rest of the way | 8.67 | 10.42 |
| Last season's win percentage × 82 | 8.85 | 11.20 |
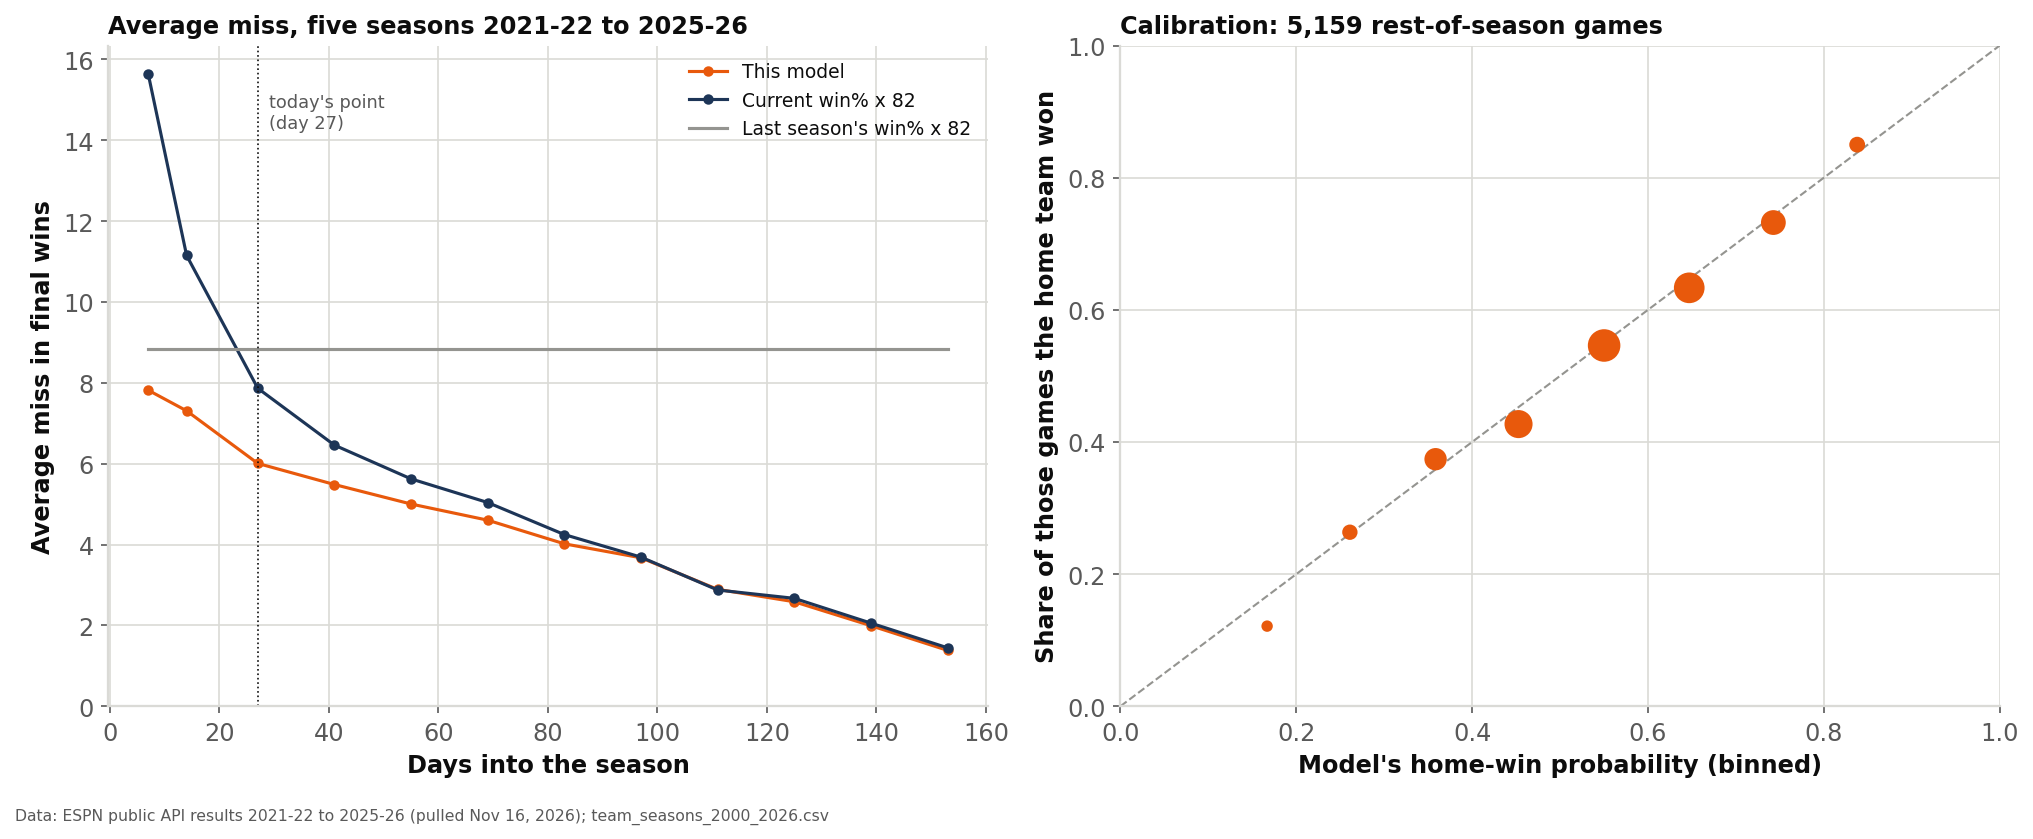
The model beat every simpler forecast in every one of the five seasons. Its average miss by season was 7.12 (2021-22), 6.08, 5.41, 6.02 and 5.39 (2025-26). The closest rival was the current winning percentage in 2023-24 (5.65 against 5.41); in the other four seasons the margin over it was 1.5 to 2.8 wins.
The same comparison at other points of the season shows why the prior matters early and fades later. A week in, the current record misses by 15.6 wins on average and the model by 7.8; at this point, 7.9 against 6.0; by day 97 the two are level (3.69 and 3.67), because by then the season's own games carry nearly all the weight in both.
Calibration
A forecast can rank teams well and still state the wrong probabilities. Calibration asks whether events forecast at 30% happen about 30% of the time. Two tests, both on the five past seasons at the day-27 cut.
Games. For each of the 5,159 games still to be played at those cuts, the model gives the home team a win probability that accounts for the rating uncertainty. Scored with the Brier score (the mean squared gap between the probability and the 0-or-1 result; lower is better) and log loss:
| Forecast of each game | Brier score | Log loss |
|---|---|---|
| This model | 0.2248 | 0.6399 |
| The model's prior alone | 0.2345 | 0.6614 |
| The two current records (log5) | 0.2377 | 0.6778 |
| Home team wins at the past seasons' home rate | 0.2476 | 0.6884 |
| Model's home-win probability | Games | Average forecast | Home team won |
|---|---|---|---|
| Under 20% | 33 | 16.7% | 12.1% |
| 20-30% | 243 | 26.1% | 26.3% |
| 30-40% | 567 | 35.8% | 37.4% |
| 40-50% | 932 | 45.3% | 42.7% |
| 50-60% | 1,282 | 55.0% | 54.6% |
| 60-70% | 1,129 | 64.7% | 63.3% |
| 70-80% | 713 | 74.3% | 73.2% |
| 80% and over | 260 | 83.8% | 85.0% |
Every bin with more than 100 games lands within 2.6 points of its forecast.
Seeds. The chance of a top-six seed and of a top-ten finish were scored on the same 150 team-seasons against the final standings. Against the base rates (12 of 30 teams get a top-six seed, 20 of 30 a top-ten place) and against the same model with no games of the season seen:
| Forecast | Top six: Brier | Top six: log loss | Top ten: Brier | Top ten: log loss |
|---|---|---|---|---|
| This model | 0.159 | 0.470 | 0.133 | 0.418 |
| The model's prior alone | 0.189 | 0.552 | 0.174 | 0.527 |
| Base rate (40% and 67%) | 0.240 | 0.673 | 0.222 | 0.637 |
| Model's chance | Forecasts | Average forecast | Happened |
|---|---|---|---|
| Under 10% | 56 | 2.6% | 3.6% |
| 10-30% | 46 | 20.8% | 23.9% |
| 30-50% | 34 | 40.2% | 44.1% |
| 50-70% | 36 | 60.6% | 69.4% |
| 70-90% | 62 | 80.1% | 75.8% |
| 90% and over | 66 | 96.6% | 90.9% |
The seed chances are good but not perfect. The top bin is the clearest flaw: forecasts of 90% or more averaged 96.6% and came true 90.9% of the time, six forecasts in 66 that the model was nearly sure of and that did not happen. A model that holds each rating still for the rest of the season will be too sure about the teams at the top, because real teams change: injuries, trades and rest are not in the data it sees.
How wide the uncertainty really is
The 80% ranges in the tables should hold the final record for about four teams in five. In the backtest they held it for 112 of 150 team-seasons, 74.7%: a little too narrow, for the same reason as the overconfident top bin. Read the ranges as slightly optimistic. A typical range is about 16 wins wide today, and on past form one team in four will finish outside its range.
What the model cannot see
- Who is playing. The model knows scores, not rosters. An injury to a star, a trade or a team resting players in April moves a real team's strength; here every rating stays where the November games put it, apart from the uncertainty drawn once per simulated season.
- How a margin was built. A 30-point win counts the same as three 10-point wins. Garbage time is not removed (why that matters).
- Schedule quirks. Back-to-backs and travel are not modelled (the back-to-back penalty measures one of them), and home court is one number for every team.
- The two December games and the tiebreakers. Both are simplified, as described above.
- Anything about the playoffs themselves. The page stops at the seeds and the play-in.
Reproduce it, and when it updates
Every game result comes from ESPN's public NBA service, saved on November 16, 2026: every team's schedule with results for 2021-22 to 2026-27 and the final standings for 2021-22 to 2025-26, bundled as data_layer/espn_games_2022_2027.csv and espn_standings_2022_2026.csv. ESPN's results match the site's own 2023-24 file on all 1,231 rows and the league's 2025-26 game log on all 1,230 games. Last season's margins come from team_seasons_2000_2026.csv. The projection table is nba_projections_2026_27.csv and every backtest and calibration figure is in nba_projections_2026_27_backtest.json. Our chart script fits the model, runs the simulation (seed 20261116) and the backtest, and pins every number on this page with an assert. The page is refreshed in place when the scores are pulled again; this version uses games through November 15, 2026.
Where the season stands
Thirteen games into a season, a team's own results deserve about as much weight as last season's, and a model that blends the two, adjusts for schedule and home court, and simulates the rest misses final records by about six wins, nearly two fewer than taking the current records as final. On that basis Boston (60.6 projected wins) and San Antonio (59.9) are the likeliest teams to take the top seeds, Houston, Oklahoma City, Minnesota and the Lakers follow in the West, and Milwaukee and Sacramento are projected for the bottom. The probabilities have been honest in the past, slightly too confident at the very top, and they will move with every week of games.
Sources & Further Reading
- Results and the 2026-27 schedule: ESPN's public NBA teams and schedule service, pulled November 16, 2026, bundled as
data_layer/espn_games_2022_2027.csv. - Final seeds, 2021-22 to 2025-26: ESPN's public standings service, same day, bundled as
data_layer/espn_standings_2022_2026.csv. - Last season's margins, 2000-01 to 2025-26: NBA.com/stats via nba_api, bundled as
data_layer/team_seasons_2000_2026.csv. - The season's opening date and the December games: the NBA's 2026-27 regular-season schedule release (NBA Communications).
- Scoring rules: Glenn W. Brier, "Verification of forecasts expressed in terms of probability", Monthly Weather Review 78 (1950).
- Related on this site: The Handoff, The Giveback, net rating to wins, why projection systems disagree and the NBA Cup.