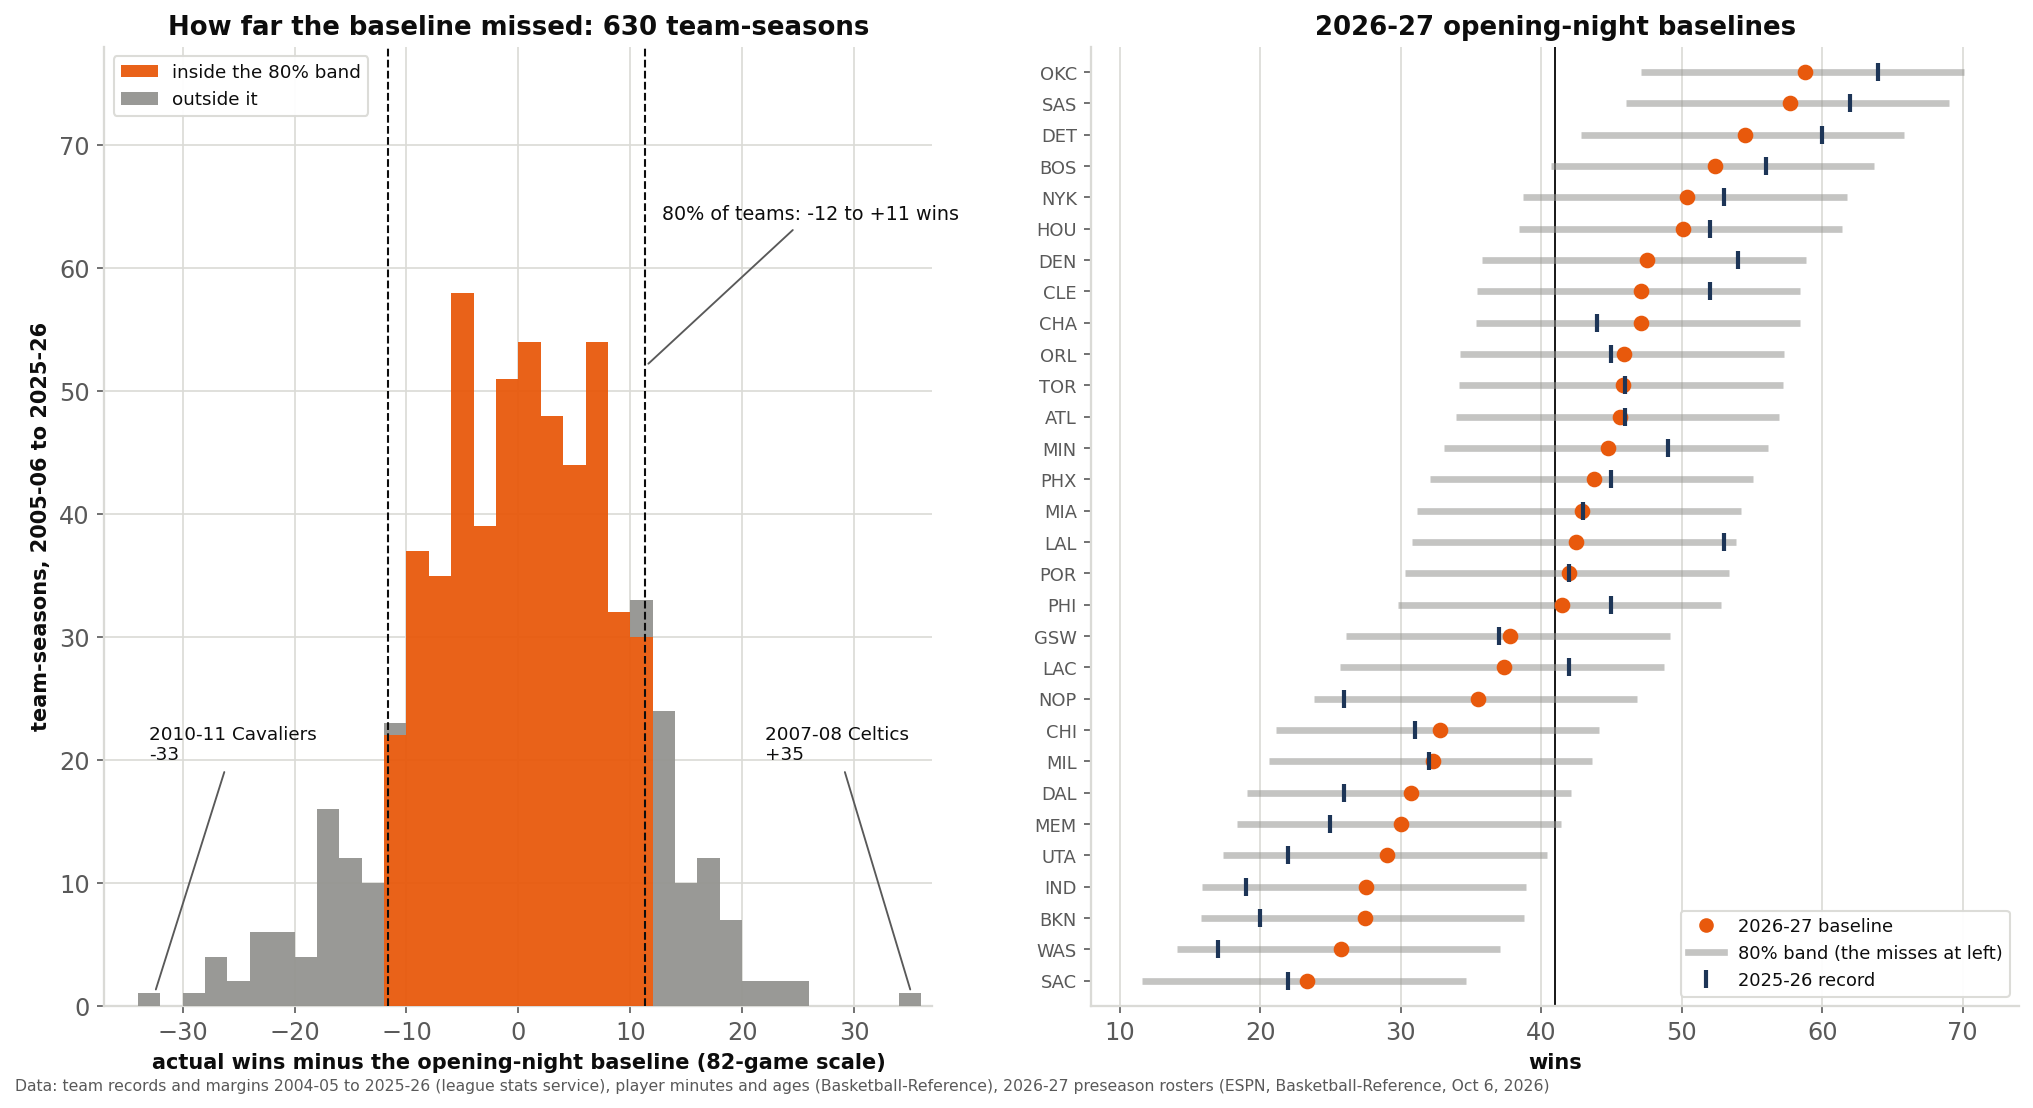
The 2026-27 season opens on Tuesday, October 20, and every preview of it starts from the same place: last season. This site has spent the autumn measuring what last season is worth, piece by piece: the margin behind a record, the luck in it, the players who came back. Put those pieces together into one baseline, test it on every season since 2005-06 without letting it see the season it is judged on, and you get the honest size of an opening-night forecast. It explains 39.6% of the spread in teams' wins. It misses by 7.65 wins on average, and one team in five lands more than eleven or twelve wins from its number. Below is that baseline for all 30 teams this season, with the band it has earned.
The baseline
Four things about a team are known before its first game, and earlier pieces here measured each of them. Last season's scoring margin is the best single guide to next season (how margin turns into wins). The luck in last season's record, the wins above or below what the margin implies, mostly does not carry over, though some of it does: a lucky win carried 0.21 of a win into the next season in The Giveback. The share of last season's minutes played by men still on the roster is worth something on top of the margin (The Continuity Dividend). And an older roster tends to slip.
We lined up every franchise with itself a season later, 630 pairs from 2004-05 → 2005-06 to 2024-25 → 2025-26, and put wins on an 82-game scale so the 66-game 2011-12 season, the 72-game 2020-21 season and the interrupted 2019-20 season count the same as the rest. Luck is a team's 82-game wins minus the wins its margin implies, from a least-squares fit on all 660 team-seasons: 41.00 wins plus 2.513 for each point of margin. Fitted on all 630 pairs, the baseline is
Baseline wins = 40.99 + 1.654 × margin + 9.158 × (returning share − 67.2%) − 0.801 × (age − 26.48) + 0.324 × luck
with standard errors of 0.10, 2.78, 0.28 and 0.12 on the four terms. Ten points of returning share are worth 0.92 of a win; a year of average age costs 0.80. Each season's 30 baselines are then shifted by the same amount so they add to 1,230 wins, the number a season holds.
How far it misses
The test is leave one season out. Each of the 21 seasons from 2005-06 to 2025-26 was forecast from a fit on the other 20, so no forecast saw the season it was judged against. The same was done for three simpler forecasts.
| Forecast | Average miss (wins) | Share of the spread in wins explained |
|---|---|---|
| Every team wins 41 | 10.28 | 0% |
| Last season's record, as it stands | 8.50 | 21.6% |
| Last season's margin, regressed | 7.78 | 36.9% |
| The baseline (margin, luck, returning share, age) | 7.65 | 39.6% |
Most of what October knows is in the margin. Swapping last season's record for its margin cuts the average miss by 0.72 of a win. The other three inputs, each of them real, cut it by another 0.13. Without luck the average miss is 7.72.
The misses themselves are wide. The median is 6.54 wins. Only 247 of the 630 team-seasons, 39.2%, finished within five wins of the baseline, and 178 missed by more than ten. Eighty per cent of the misses fall between 11.7 wins short and 11.3 wins over, a band 23 wins wide, and that is the band in the table further down. The worst season to forecast was the last one: 2025-26's baselines missed by 9.43 wins on average, against 4.86 in 2016-17, the easiest. In 2013-14 and 2020-21 only 20 of the 30 teams finished inside the band; in 2025-26, 22.
data_layer/team_seasons_2000_2026.csv, player_team_minutes_2005_2026.csv and the October 6, 2026 rosters. Charted and verified by chart_the_starting_line.py, 99 asserts.Where the rest goes
Part of any miss is the record's own noise. Even a forecaster who knew a team's final margin in advance would miss its record by 2.6 wins on average, the close games that go one way or the other. That noise is 11% of the baseline's squared error. The other 89% is change in how good teams are between one October and the next, which the four inputs cannot see: who arrived, who got hurt, who improved.
The largest misses show what the inputs cannot see. The 2007-08 Celtics came off a 24-58 season with a −3.4 margin and only 38.8% of their minutes back. The baseline said 30.9 wins. They went 66-16, 35.1 wins over. The returning share counts the minutes that left, not the quality of the minutes that came in. The 2010-11 Cavaliers had gone 61-21 with a +6.5 margin and kept 62.8% of their minutes, a little below the 67.2% average. The baseline said 51.5. They went 19-63, 32.5 short. A share of minutes cannot tell which third of the minutes left. Three of the eleven largest misses in the file come from the season just finished: Indiana (baseline 46.6, went 19-63), San Antonio (baseline 36.9, went 62-20) and Memphis (baseline 49.0, went 25-57).
The baseline is also cautious by construction. Its numbers have a standard deviation of 7.9 wins; real records have one of 12.4. Its top team's baseline averaged 56.2 wins across the 21 seasons, while the league's best record averaged 64.2, and its top team had the best record in only 6 of the 21. Of its top ten teams, 6.7 on average finished in the real top ten (from 5 to 9). It picked the right side of .500 for 71.0% of teams. Strong baselines are the safest: the 49 team-seasons with a baseline of 52 wins or more missed by 5.5 on average, against 8.5 for the 244 between 30 and 41.
2026-27, team by team
For this season the inputs come from the 2025-26 records and margins, 2025-26 minutes and ages, and the preseason rosters of October 6: a player counts as back only when both ESPN's and Basketball-Reference's rosters list him, as in the continuity piece. The 30 raw baselines added to 1,241 wins, so each was lowered by 0.36. The last column reads the 630 historical misses as a distribution: it is the share of them that would carry a team from its baseline to 42 wins or more.
| Team | 2025-26 | Margin | Luck | Back | Baseline | 80% band | Winning record |
|---|---|---|---|---|---|---|---|
| Oklahoma City Thunder | 64-18 | +11.1 | −4.9 | 70.8% | 58.8 | 47–70 | 96% |
| San Antonio Spurs | 62-20 | +8.3 | +0.1 | 93.8% | 57.7 | 46–69 | 95% |
| Detroit Pistons | 60-22 | +8.2 | −1.6 | 72.8% | 54.5 | 43–66 | 91% |
| Boston Celtics | 56-26 | +7.7 | −4.4 | 75.4% | 52.4 | 41–64 | 90% |
| New York Knicks | 53-29 | +6.3 | −3.8 | 88.5% | 50.4 | 39–62 | 85% |
| Houston Rockets | 52-30 | +5.2 | −2.1 | 84.1% | 50.1 | 38–61 | 85% |
| Denver Nuggets | 54-28 | +5.1 | +0.2 | 61.1% | 47.5 | 36–59 | 76% |
| Cleveland Cavaliers | 52-30 | +4.1 | +0.7 | 67.8% | 47.1 | 35–58 | 75% |
| Charlotte Hornets | 44-38 | +4.8 | −9.1 | 61.2% | 47.1 | 35–58 | 75% |
| Orlando Magic | 45-37 | +0.6 | +2.5 | 90.3% | 45.9 | 34–57 | 71% |
| Toronto Raptors | 46-36 | +2.8 | −2.0 | 66.3% | 45.9 | 34–57 | 70% |
| Atlanta Hawks | 46-36 | +2.4 | −1.0 | 70.7% | 45.6 | 34–57 | 70% |
| Minnesota Timberwolves | 49-33 | +3.4 | −0.5 | 65.6% | 44.8 | 33–56 | 65% |
| Phoenix Suns | 45-37 | +1.5 | +0.2 | 76.0% | 43.8 | 32–55 | 62% |
| Miami Heat | 43-39 | +2.3 | −3.8 | 61.5% | 42.9 | 31–54 | 59% |
| Los Angeles Lakers | 53-29 | +1.8 | +7.5 | 42.4% | 42.5 | 31–54 | 58% |
| Portland Trail Blazers | 42-40 | −0.3 | +1.8 | 70.4% | 42.0 | 30–53 | 56% |
| Philadelphia 76ers | 45-37 | −0.2 | +4.5 | 56.1% | 41.5 | 30–53 | 53% |
| Golden State Warriors | 37-45 | −0.6 | −2.5 | 74.3% | 37.8 | 26–49 | 39% |
| LA Clippers | 42-40 | +1.1 | −1.8 | 49.2% | 37.4 | 26–49 | 37% |
| New Orleans Pelicans | 26-56 | −4.5 | −3.7 | 84.6% | 35.5 | 24–47 | 30% |
| Chicago Bulls | 31-51 | −5.2 | +3.1 | 54.7% | 32.8 | 21–44 | 20% |
| Milwaukee Bucks | 32-50 | −6.2 | +6.6 | 70.2% | 32.3 | 21–44 | 19% |
| Dallas Mavericks | 26-56 | −5.5 | −1.2 | 61.0% | 30.8 | 19–42 | 14% |
| Memphis Grizzlies | 25-57 | −6.0 | −0.9 | 47.4% | 30.1 | 18–41 | 12% |
| Utah Jazz | 22-60 | −8.4 | +2.1 | 63.8% | 29.0 | 17–40 | 10% |
| Indiana Pacers | 19-63 | −8.0 | −1.9 | 72.2% | 27.6 | 16–39 | 7% |
| Brooklyn Nets | 20-62 | −10.0 | +4.1 | 63.2% | 27.5 | 16–39 | 7% |
| Washington Wizards | 17-65 | −12.0 | +6.2 | 73.3% | 25.7 | 14–37 | 5% |
| Sacramento Kings | 22-60 | −10.0 | +6.1 | 52.8% | 23.3 | 12–35 | 2% |
The Lakers, worked through
The Lakers are the clearest case of a record and a baseline parting ways. They went 53-29 on a margin of +1.8 a game, 7.5 wins of luck, the most in the league. They have 42.4% of last season's minutes on both rosters, the fewest, and their minutes-weighted age was 28.04, 1.56 years above the file's average. Term by term:
- Margin: 1.654 × 1.8 = +2.98.
- Returning share: 9.158 × (42.4% − 67.2%) = −2.27.
- Age: 0.801 × 1.56 = −1.25.
- Luck: 0.324 × 7.5 = +2.43.
So 40.99 + 2.98 − 2.27 − 1.25 + 2.43 = 42.88, and after the league-wide shift of 0.36, 42.5 wins: a 53-win team rated as a .500 team, with a 58% chance of a winning record. Charlotte is the mirror image: 44-38 on a +4.8 margin, 9.1 wins of bad luck, the most in the league, and a young roster (23.98). Its baseline is 47.1, 4.6 wins ahead of the Lakers. The Giveback made the same point from margins alone; the roster and age terms widen the gap.
Reading the first weeks
A baseline is where a team starts, not where it ends. Two other pieces on this site say when to let go of it. The preseason adds real information about rebounding and turnovers and none about shooting (The October Glass); this baseline leaves the preseason out, because the site has not pulled 2026-27's preseason numbers. And once the games start, a team's own margin overtakes last season's at about game six (The Handoff). Between now and then, a baseline with a band 23 wins wide is the honest summary of what is known.
What this does not show
- Who the new players are. The returning share measures the minutes that stayed. It knows nothing about the players who arrived, which is how the 2007-08 Celtics beat their baseline by 35 wins.
- Moves after October 6. The rosters are the ones both sources listed that day. A trade, signing or waiver since then is not in the table.
- Health. Nothing here knows who is injured or for how long.
- A projection system. This is a baseline from four public numbers, built to show how much they can tell. Projection systems that rate players one by one use more information, and disagree with each other for their own reasons (why projection systems disagree).
- The band's shape for one team. The 80% band and the winning-record chance come from the pooled misses of all 630 team-seasons. Strong baselines missed by less in the past, so the bands at the top of the table are probably a little too wide and those in the middle a little too narrow.
Reproduce it
chart_the_starting_line.py reads the bundled files (team_seasons_2000_2026.csv, player_team_minutes_2005_2026.csv, rosters_2026_10_06.csv and rosters_2026_10_06_bref.csv), builds the 630 pairs, fits the luck line on all 660 team-seasons, runs the four forecasts season by season with each season held out, applies the full fit to the 2026-27 rosters, pins every figure above with an assert (99 in all), checks this page's text and table against the data, and draws the chart. It runs offline; nothing new was fetched for this piece.
The bottom line
The best opening-night baseline the site's own numbers allow explains about 40% of an NBA season and misses by about seven and a half wins on average. Most of what it knows is last season's margin. Luck, the returning roster and age add real but small corrections. By that baseline Oklahoma City (58.8) and San Antonio (57.7) start at the top and Sacramento (23.3) at the bottom, and the 53-win Lakers start at 42.5. Every one of those numbers comes with a band 23 wins wide, and on past form one team in five will finish outside it.
Sources & Further Reading
- Team records and margins: NBA.com/stats via nba_api (LeagueDashTeamStats, retrieved June 2026), bundled as
data_layer/team_seasons_2000_2026.csv. - Player minutes and ages by team: Basketball-Reference season totals, 2004-05 to 2025-26, bundled as
data_layer/player_team_minutes_2005_2026.csv. - 2026-27 rosters: ESPN's public team roster service and Basketball-Reference's 2026-27 team pages, both retrieved October 6, 2026, bundled as
data_layer/rosters_2026_10_06.csvanddata_layer/rosters_2026_10_06_bref.csv. - The opening date: the NBA's 2026-27 regular-season schedule release (NBA Communications, read October 13, 2026), which has the season beginning on Tuesday, October 20.
- Related on this site: The Giveback, The Continuity Dividend, The October Glass, The Handoff, net rating to wins, Pythagorean expectation and why projection systems disagree.